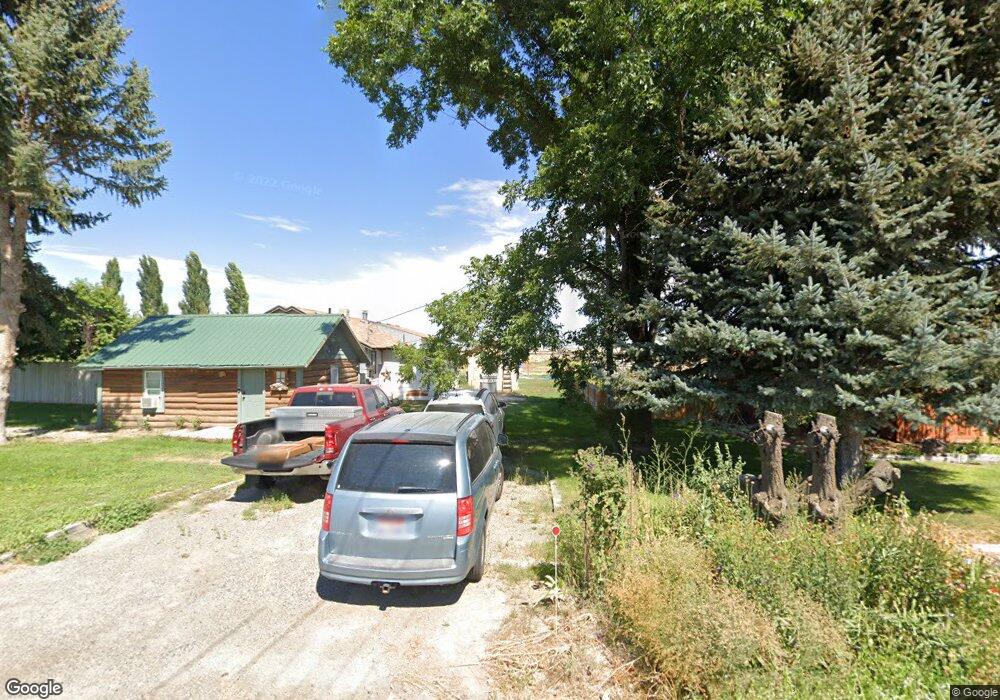
3560 E 4000 N Kimberly, ID 83341
Estimated Value: $260,000 - $417,000
2
Beds
1
Bath
1,210
Sq Ft
$284/Sq Ft
Est. Value
About This Home
This home is located at 3560 E 4000 N, Kimberly, ID 83341 and is currently estimated at $343,116, approximately $283 per square foot. 3560 E 4000 N is a home located in Twin Falls County with nearby schools including Kimberly Elementary School, STRICKER ELEMENTARY SCHOOL, and Kimberly Middle School.
Ownership History
Date
Name
Owned For
Owner Type
Purchase Details
Closed on
Jul 3, 2025
Sold by
Westfall Raymond Stanley
Bought by
Westfall Raymond Stanley and Westfall Mickelle
Current Estimated Value
Purchase Details
Closed on
Aug 14, 2015
Sold by
Westfall George Michael and Westfall Michael Westfall
Bought by
Westfall Raymond Stanley
Home Financials for this Owner
Home Financials are based on the most recent Mortgage that was taken out on this home.
Original Mortgage
$56,181
Interest Rate
4.05%
Mortgage Type
New Conventional
Create a Home Valuation Report for This Property
The Home Valuation Report is an in-depth analysis detailing your home's value as well as a comparison with similar homes in the area
Purchase History
| Date | Buyer | Sale Price | Title Company |
|---|---|---|---|
| Westfall Raymond Stanley | -- | Titlefact | |
| Westfall Raymond Stanley | -- | Titlefact Inc |
Source: Public Records
Mortgage History
| Date | Status | Borrower | Loan Amount |
|---|---|---|---|
| Previous Owner | Westfall Raymond Stanley | $56,181 |
Source: Public Records
Tax History
| Year | Tax Paid | Tax Assessment Tax Assessment Total Assessment is a certain percentage of the fair market value that is determined by local assessors to be the total taxable value of land and additions on the property. | Land | Improvement |
|---|---|---|---|---|
| 2025 | $1,320 | $195,929 | $73,895 | $122,034 |
| 2024 | $1,297 | $195,929 | $73,895 | $122,034 |
| 2023 | $1,055 | $148,619 | $73,895 | $74,724 |
| 2022 | $1,061 | $130,425 | $53,095 | $77,330 |
| 2021 | $1,138 | $103,648 | $43,465 | $60,183 |
| 2020 | $1,157 | $99,325 | $43,465 | $55,860 |
| 2019 | $1,010 | $87,324 | $32,517 | $54,807 |
| 2018 | $1,013 | $86,271 | $32,517 | $53,754 |
| 2017 | $854 | $72,607 | $32,517 | $40,090 |
| 2016 | $846 | $68,274 | $0 | $0 |
| 2015 | $836 | $68,274 | $32,517 | $35,757 |
| 2012 | -- | $56,280 | $0 | $0 |
Source: Public Records
Map
Nearby Homes
Your Personal Tour Guide
Ask me questions while you tour the home.