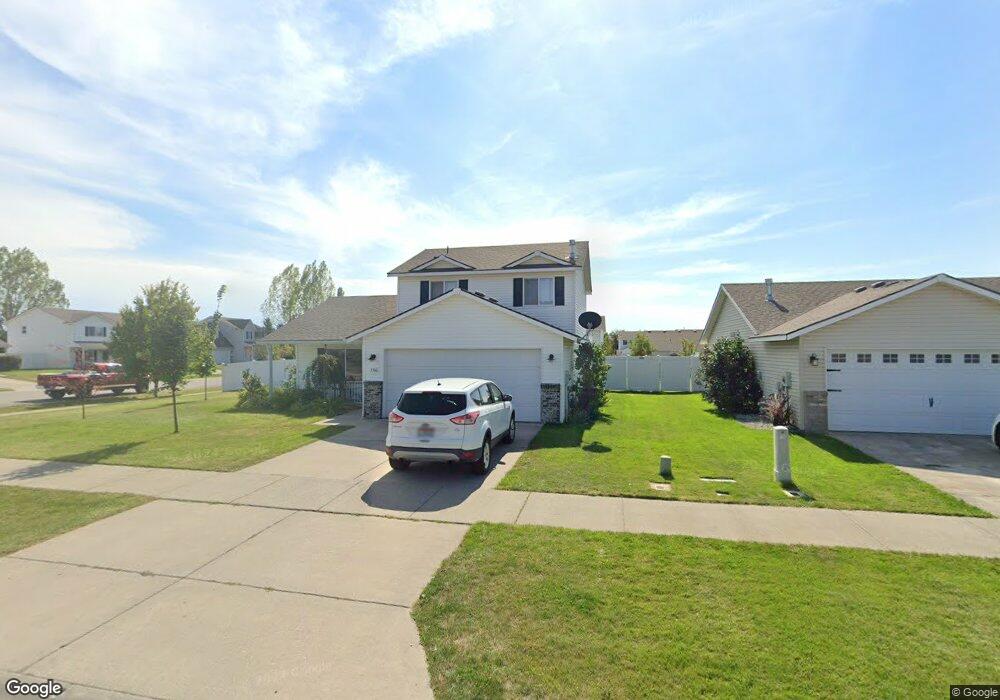
3560 W Manning Loop Coeur D Alene, ID 83815
Atlas-Prairie NeighborhoodEstimated Value: $456,034 - $482,000
4
Beds
2
Baths
1,545
Sq Ft
$303/Sq Ft
Est. Value
About This Home
This home is located at 3560 W Manning Loop, Coeur D Alene, ID 83815 and is currently estimated at $467,759, approximately $302 per square foot. 3560 W Manning Loop is a home located in Kootenai County with nearby schools including Skyway Elementary School, Woodland Middle School, and Lake City High School.
Ownership History
Date
Name
Owned For
Owner Type
Purchase Details
Closed on
Nov 27, 2013
Sold by
Fritz Randolph B and Fritz Susan K
Bought by
Fritz Sean A
Current Estimated Value
Home Financials for this Owner
Home Financials are based on the most recent Mortgage that was taken out on this home.
Original Mortgage
$169,900
Outstanding Balance
$146,205
Interest Rate
4.23%
Mortgage Type
Purchase Money Mortgage
Estimated Equity
$321,554
Purchase Details
Closed on
Mar 27, 2013
Sold by
Rotheram Joyce
Bought by
Fritz Randolph B and Fritz Susan K
Purchase Details
Closed on
Oct 18, 2004
Sold by
Copper Basin Construction Inc
Bought by
Rotheram Joyce
Home Financials for this Owner
Home Financials are based on the most recent Mortgage that was taken out on this home.
Original Mortgage
$138,400
Interest Rate
5.37%
Mortgage Type
Adjustable Rate Mortgage/ARM
Create a Home Valuation Report for This Property
The Home Valuation Report is an in-depth analysis detailing your home's value as well as a comparison with similar homes in the area
Home Values in the Area
Average Home Value in this Area
Purchase History
| Date | Buyer | Sale Price | Title Company |
|---|---|---|---|
| Fritz Sean A | -- | Alliance Title | |
| Fritz Randolph B | -- | Alliance Title | |
| Rotheram Joyce | -- | -- |
Source: Public Records
Mortgage History
| Date | Status | Borrower | Loan Amount |
|---|---|---|---|
| Open | Fritz Sean A | $169,900 | |
| Previous Owner | Rotheram Joyce | $138,400 |
Source: Public Records
Tax History Compared to Growth
Tax History
| Year | Tax Paid | Tax Assessment Tax Assessment Total Assessment is a certain percentage of the fair market value that is determined by local assessors to be the total taxable value of land and additions on the property. | Land | Improvement |
|---|---|---|---|---|
| 2025 | $1,334 | $389,300 | $180,000 | $209,300 |
| 2024 | $1,341 | $390,540 | $180,000 | $210,540 |
| 2023 | $1,341 | $424,226 | $180,000 | $244,226 |
| 2022 | $1,900 | $482,672 | $213,180 | $269,492 |
| 2021 | $1,463 | $292,766 | $112,200 | $180,566 |
| 2020 | $1,318 | $245,025 | $93,500 | $151,525 |
| 2019 | $1,403 | $227,208 | $85,000 | $142,208 |
| 2018 | $1,271 | $202,120 | $72,727 | $129,393 |
| 2017 | $1,165 | $170,614 | $55,944 | $114,670 |
| 2016 | $1,120 | $155,000 | $46,620 | $108,380 |
| 2015 | $1,136 | $152,770 | $44,400 | $108,370 |
| 2013 | $1,012 | $129,780 | $31,500 | $98,280 |
Source: Public Records
Map
Nearby Homes
- 7291 N Grafton St
- 7365 N Breaux
- 7374 N Breaux
- 7379 Breaux Dr
- 3177 W Wilbur Ave
- 7350 N Breaux Dr
- 7400 Breaux Dr
- 7388 Breaux Dr
- 7336 Breaux Dr
- 7322 Breaux Dr
- 3588 W Loxton Loop
- 2994 W Wilbur Ave
- 4407 W Lennox Loop
- 4147 W Homeward Bound Blvd
- 7996 N Hibiscus Ln
- 6553 N Kite Ln
- 8042 N Hibiscus Ln
- 2002 W Freeland Dr
- 7857 Quincy Ct
- 6969 N Freestyle Dr
- 3582 W Manning Loop
- 3420 W Manning Loop
- 3602 W Manning Loop
- 3390 W Manning Loop
- 3523 W Manning Loop
- 3503 W Manning Loop
- 3569 W Manning Loop
- 3370 W Manning Loop
- 3549 W Manning Loop
- 3620 W Manning Loop
- 3585 W Manning Loop
- 3469 W Manning Loop
- 3539 W Manning Loop
- 3529 W Manning Loop
- 3603 W Manning Loop
- 3356 W Manning Loop
- 3619 W Manning Loop
- 3449 W Manning Loop
- 3216 W Thorndale Loop
- 3334 W Manning Loop