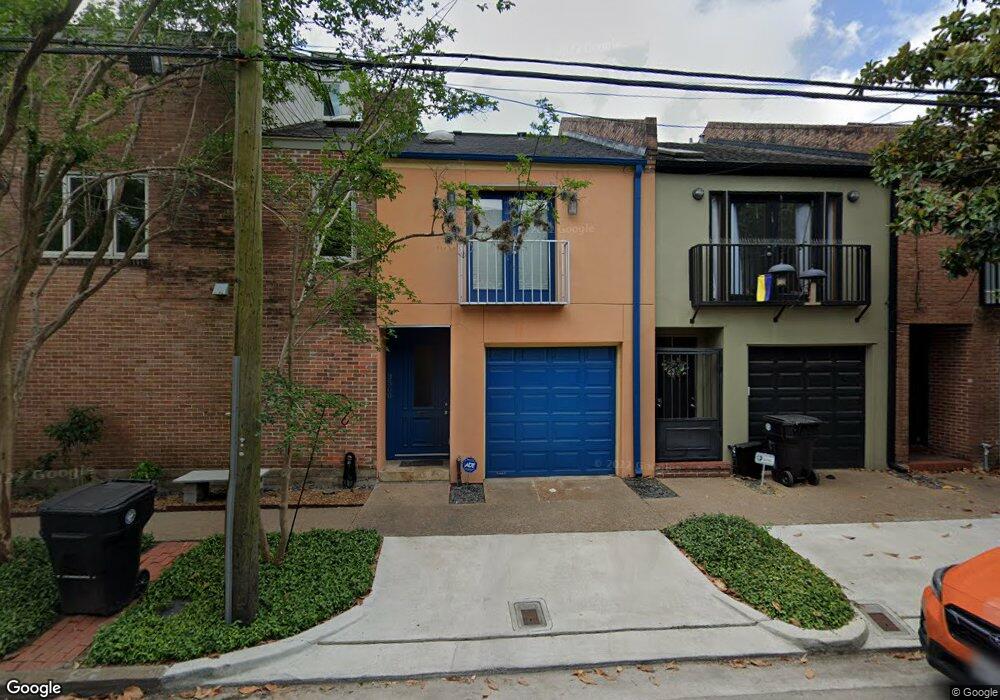
3560 Yupon St Houston, TX 77006
Montrose NeighborhoodEstimated Value: $379,866 - $619,000
2
Beds
2
Baths
1,376
Sq Ft
$338/Sq Ft
Est. Value
About This Home
This home is located at 3560 Yupon St, Houston, TX 77006 and is currently estimated at $465,467, approximately $338 per square foot. 3560 Yupon St is a home located in Harris County with nearby schools including Baker Montessori, Lanier Middle School, and Lamar High School.
Ownership History
Date
Name
Owned For
Owner Type
Purchase Details
Closed on
Dec 18, 2015
Sold by
Salmons Jessica E
Bought by
Baker Stephanie M
Current Estimated Value
Purchase Details
Closed on
Aug 5, 2013
Sold by
Lowe Bobby
Bought by
Baker Stephanie M and Salmons Jessica E
Home Financials for this Owner
Home Financials are based on the most recent Mortgage that was taken out on this home.
Original Mortgage
$247,500
Interest Rate
4.49%
Mortgage Type
New Conventional
Purchase Details
Closed on
Jul 27, 2012
Sold by
Medeiros Koontz Rex Ashley and Medeiros Koontz Daniela
Bought by
Lowe Bobby
Purchase Details
Closed on
Jan 25, 2002
Sold by
Darnell Carl Arthur
Bought by
Koontz Rex Ashley and Epstein Daniela Medeiros
Home Financials for this Owner
Home Financials are based on the most recent Mortgage that was taken out on this home.
Original Mortgage
$129,400
Interest Rate
7.07%
Create a Home Valuation Report for This Property
The Home Valuation Report is an in-depth analysis detailing your home's value as well as a comparison with similar homes in the area
Home Values in the Area
Average Home Value in this Area
Purchase History
| Date | Buyer | Sale Price | Title Company |
|---|---|---|---|
| Baker Stephanie M | -- | Capital Title | |
| Baker Stephanie M | -- | Chicago Title | |
| Lowe Bobby | -- | None Available | |
| Koontz Rex Ashley | -- | First American Title |
Source: Public Records
Mortgage History
| Date | Status | Borrower | Loan Amount |
|---|---|---|---|
| Previous Owner | Baker Stephanie M | $247,500 | |
| Previous Owner | Koontz Rex Ashley | $129,400 |
Source: Public Records
Tax History Compared to Growth
Tax History
| Year | Tax Paid | Tax Assessment Tax Assessment Total Assessment is a certain percentage of the fair market value that is determined by local assessors to be the total taxable value of land and additions on the property. | Land | Improvement |
|---|---|---|---|---|
| 2025 | $4,130 | $378,000 | $88,000 | $290,000 |
| 2024 | $4,130 | $298,098 | $88,000 | $210,098 |
| 2023 | $4,130 | $326,492 | $88,000 | $238,492 |
| 2022 | $6,480 | $294,276 | $72,000 | $222,276 |
| 2021 | $7,323 | $314,200 | $84,000 | $230,200 |
| 2020 | $8,476 | $357,618 | $108,800 | $248,818 |
| 2019 | $8,247 | $325,902 | $87,040 | $238,862 |
| 2018 | $6,056 | $312,500 | $87,040 | $225,460 |
| 2017 | $8,292 | $312,500 | $87,040 | $225,460 |
| 2016 | $8,292 | $312,500 | $87,040 | $225,460 |
| 2015 | -- | $334,252 | $87,040 | $247,212 |
| 2014 | -- | $285,817 | $76,160 | $209,657 |
Source: Public Records
Map
Nearby Homes
- 3515 Yupon St
- 3403 Yupon St
- 3540 Yupon St
- 1503 Harold St
- 3311 Yupon St Unit 611
- 3311 Yupon St Unit 519
- 1621 California St
- 1507 Kipling St
- 1511 Kipling St
- 1510 Marshall St
- 1517 Kipling St
- 1101 Hawthorne St
- 1540 Hawthorne St Unit 4
- 1539 Westheimer Rd
- 1512 W Alabama St
- 1531 Marshall St Unit 3
- 1612 Kipling St
- 3705 Mandell St Unit 8
- 1620 Harold St
- 1621 Cherryhurst St
- 3550 Yupon St
- 1400 Kipling St
- 3530 Yupon St
- 1404 Kipling St
- 1404 Kipling St Unit 1
- 3520 Yupon St
- 1408 Kipling St
- 1412 Kipling St
- 3531 Yupon St
- 3527 Yupon St
- 3510 Yupon St
- 3523 Yupon St
- 3519 Yupon St
- 1414 Kipling St
- 3506 Yupon St
- 1401 Kipling St Unit 14
- 1401 Kipling St Unit 17
- 1401 Kipling St Unit 16
- 1401 Kipling St Unit 21
- 1401 Kipling St Unit 2