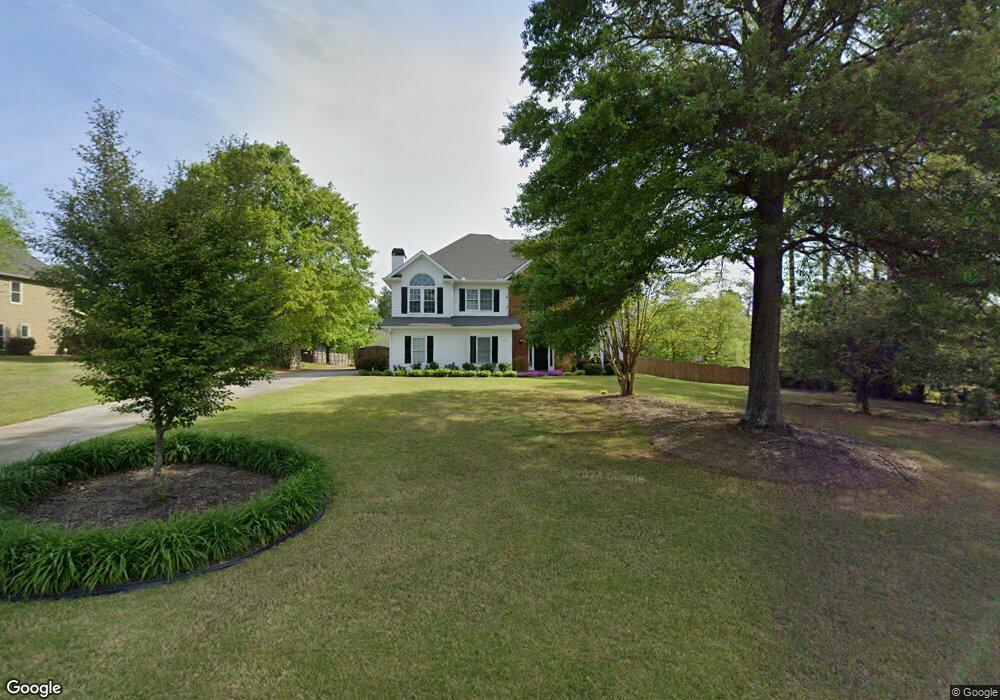
3561 Apalachee Ridge Monroe, GA 30656
Estimated Value: $395,000 - $475,000
--
Bed
1
Bath
2,412
Sq Ft
$185/Sq Ft
Est. Value
About This Home
This home is located at 3561 Apalachee Ridge, Monroe, GA 30656 and is currently estimated at $445,131, approximately $184 per square foot. 3561 Apalachee Ridge is a home located in Walton County with nearby schools including Walker Park Elementary School, Carver Middle School, and Monroe Area High School.
Ownership History
Date
Name
Owned For
Owner Type
Purchase Details
Closed on
Jun 2, 2022
Sold by
Miller James
Bought by
James And Patti Miller Liv Tr
Current Estimated Value
Purchase Details
Closed on
Nov 6, 2006
Sold by
Pettyjohn William R and Pettyjohn Cathy Y
Bought by
Miller James L
Home Financials for this Owner
Home Financials are based on the most recent Mortgage that was taken out on this home.
Original Mortgage
$173,600
Interest Rate
6.27%
Mortgage Type
New Conventional
Purchase Details
Closed on
Aug 29, 1995
Sold by
Montogomery Homes Inc
Bought by
Pettyjohn William and Lawlor Cathy
Purchase Details
Closed on
Oct 25, 1994
Sold by
Warren Lora
Bought by
Montgomery Homes
Home Financials for this Owner
Home Financials are based on the most recent Mortgage that was taken out on this home.
Original Mortgage
$102,000
Interest Rate
8.68%
Mortgage Type
Construction
Create a Home Valuation Report for This Property
The Home Valuation Report is an in-depth analysis detailing your home's value as well as a comparison with similar homes in the area
Home Values in the Area
Average Home Value in this Area
Purchase History
| Date | Buyer | Sale Price | Title Company |
|---|---|---|---|
| James And Patti Miller Liv Tr | -- | -- | |
| Miller James L | $217,000 | -- | |
| Pettyjohn William | $137,900 | -- | |
| Montgomery Homes | $20,000 | -- |
Source: Public Records
Mortgage History
| Date | Status | Borrower | Loan Amount |
|---|---|---|---|
| Previous Owner | Miller James L | $173,600 | |
| Previous Owner | Montgomery Homes | $102,000 | |
| Closed | Pettyjohn William | $0 |
Source: Public Records
Tax History Compared to Growth
Tax History
| Year | Tax Paid | Tax Assessment Tax Assessment Total Assessment is a certain percentage of the fair market value that is determined by local assessors to be the total taxable value of land and additions on the property. | Land | Improvement |
|---|---|---|---|---|
| 2024 | $1,192 | $124,436 | $24,000 | $100,436 |
| 2023 | $1,171 | $117,876 | $24,000 | $93,876 |
| 2022 | $1,145 | $110,316 | $21,600 | $88,716 |
| 2021 | $2,948 | $97,716 | $16,000 | $81,716 |
| 2020 | $2,964 | $94,956 | $16,000 | $78,956 |
| 2019 | $2,852 | $87,156 | $16,000 | $71,156 |
| 2018 | $2,799 | $87,156 | $16,000 | $71,156 |
| 2017 | $3,003 | $87,156 | $16,000 | $71,156 |
| 2016 | $2,547 | $77,532 | $16,000 | $61,532 |
| 2015 | $2,235 | $67,252 | $16,000 | $51,252 |
| 2014 | -- | $65,028 | $16,000 | $49,028 |
Source: Public Records
Map
Nearby Homes
- 3589 Fannie Thompson Rd NW
- 3625 Fannie Thompson Rd NW
- 3601 Fannie Thompson Rd NW
- 1101 Longleaf Trace
- 1074 Pine View Trail
- 3680 Apalachee Ridge
- 3800 George Williams Rd
- 1252 White Columns Dr
- 480 Raider Way
- 410 Providence Club Dr
- 380 Fairway Cir
- 436 James Powers Rd
- 3051 Glenview Ln
- (GA)The Cooper | Side Entry Plan at Stonegate
- Riley A.2 3 Side Entry Plan at Stonegate
- (GA)The Kirkland | Side Entry Plan at Stonegate
- (GA)Woodmont A.1 3 Side Entry Plan at Stonegate
- (GA)The Woodmont | Side Entry Plan at Stonegate
- The Riley | Side Entry Plan at Stonegate
- 3084 George Williams Rd
- 3571 Apalachee Ridge
- 3551 Apalachee Ridge
- 3560 Apalachee Ridge
- 3570 Apalachee Ridge
- 3550 Apalachee Ridge
- 3581 Apalachee Ridge
- 3580 Apalachee Ridge
- 740 Carl Davis Rd
- 3591 Apalachee Ridge
- 3590 Apalachee Ridge
- 630 Carl Davis Rd NW
- 3600 Apalachee Ridge
- 655 Carl Davis Rd NW
- 3611 Apalachee Ridge
- 3674 Lower Tanners Bridge Rd
- 3610 Apalachee Ridge Unit 45
- 3610 Apalachee Ridge
- 3621 Apalachee Ridge
- 3659 Lower Tanners Bridge Rd
- 760 Carl Davis Rd