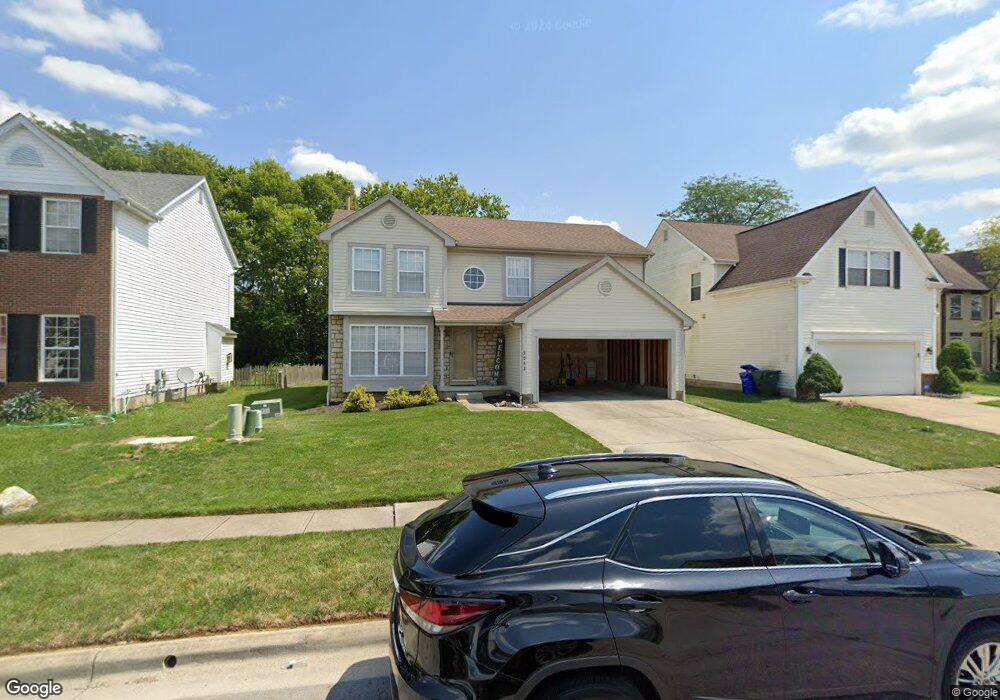
3562 Creek Meadows Dr Pickerington, OH 43147
Estimated Value: $354,443 - $401,000
4
Beds
3
Baths
1,870
Sq Ft
$206/Sq Ft
Est. Value
About This Home
This home is located at 3562 Creek Meadows Dr, Pickerington, OH 43147 and is currently estimated at $384,361, approximately $205 per square foot. 3562 Creek Meadows Dr is a home located in Fairfield County with nearby schools including Violet Elementary School, Pickerington Elementary School, and Pickerington Ridgeview Junior High School.
Ownership History
Date
Name
Owned For
Owner Type
Purchase Details
Closed on
Jul 30, 2004
Sold by
Gamble Donny
Bought by
Scott Curtis D
Current Estimated Value
Home Financials for this Owner
Home Financials are based on the most recent Mortgage that was taken out on this home.
Original Mortgage
$198,100
Outstanding Balance
$117,871
Interest Rate
9.15%
Mortgage Type
Purchase Money Mortgage
Estimated Equity
$266,490
Purchase Details
Closed on
Oct 24, 2003
Sold by
Mobley Homes Of Ohio Llc
Bought by
Gamble Donny
Home Financials for this Owner
Home Financials are based on the most recent Mortgage that was taken out on this home.
Original Mortgage
$172,000
Interest Rate
6.02%
Mortgage Type
FHA
Purchase Details
Closed on
Mar 27, 2002
Sold by
Homewood Corp
Bought by
Trinity Home Builders Inc
Create a Home Valuation Report for This Property
The Home Valuation Report is an in-depth analysis detailing your home's value as well as a comparison with similar homes in the area
Home Values in the Area
Average Home Value in this Area
Purchase History
| Date | Buyer | Sale Price | Title Company |
|---|---|---|---|
| Scott Curtis D | $198,100 | -- | |
| Gamble Donny | $176,100 | Preferred Title Agency Inc | |
| Trinity Home Builders Inc | $587,880 | -- |
Source: Public Records
Mortgage History
| Date | Status | Borrower | Loan Amount |
|---|---|---|---|
| Open | Scott Curtis D | $198,100 | |
| Previous Owner | Gamble Donny | $172,000 |
Source: Public Records
Tax History Compared to Growth
Tax History
| Year | Tax Paid | Tax Assessment Tax Assessment Total Assessment is a certain percentage of the fair market value that is determined by local assessors to be the total taxable value of land and additions on the property. | Land | Improvement |
|---|---|---|---|---|
| 2024 | $8,036 | $81,620 | $10,500 | $71,120 |
| 2023 | $3,175 | $81,620 | $10,500 | $71,120 |
| 2022 | $3,184 | $81,620 | $10,500 | $71,120 |
| 2021 | $3,030 | $67,070 | $10,500 | $56,570 |
| 2020 | $3,064 | $67,070 | $10,500 | $56,570 |
| 2019 | $3,086 | $67,070 | $10,500 | $56,570 |
| 2018 | $2,956 | $54,480 | $8,780 | $45,700 |
| 2017 | $2,959 | $56,740 | $8,350 | $48,390 |
| 2016 | $2,936 | $56,740 | $8,350 | $48,390 |
| 2015 | $2,800 | $51,430 | $8,350 | $43,080 |
| 2014 | $2,756 | $51,430 | $8,350 | $43,080 |
| 2013 | $2,756 | $51,430 | $8,350 | $43,080 |
Source: Public Records
Map
Nearby Homes
- 3535 Wheatfield Dr
- 0 Refugee Rd
- 7287 Candlestone Dr
- 3233 Mahaffey Ct
- 3205 Mahaffey Ct
- 3682 Winding Path Dr
- 3212 Southern Hills Dr
- 3161 Innisbrook Ct
- 7673 Harbour Town Dr
- 7490 Sugarbark Ct
- 3266 Tumwater Valley Dr
- 7505 Winding Path Ct
- 7449 Sugarbark Ct
- 3878 Willow Branch Dr
- 3139 Highland Park Dr
- 7801 Cedar Ridge Dr
- 3088 Alderbrook Dr
- 7619 Kittansett Ln
- 3077 Highland Park Dr
- 3265 O'Heagra Dr
- 3570 Creek Meadows Dr
- 3554 Creek Meadows Dr
- 3569 Wheatfield Dr
- 3546 Creek Meadows Dr
- 3578 Creek Meadows Dr
- 3581 Wheatfield Dr
- 3555 Wheatfield Dr
- 3553 Creek Meadows Dr
- 3595 Wheatfield Dr
- 3547 Wheatfield Dr
- 3561 Creek Meadows Dr
- 3538 Creek Meadows Dr
- 3545 Creek Meadows Dr
- 3569 Creek Meadows Dr
- 3537 Creekmeadow Dr
- 3537 Creek Meadows Dr
- 3530 Creek Meadows Dr
- 3529 Creek Meadows Dr
- 7520 Tillman Ct
- 7521 Tillman Ct