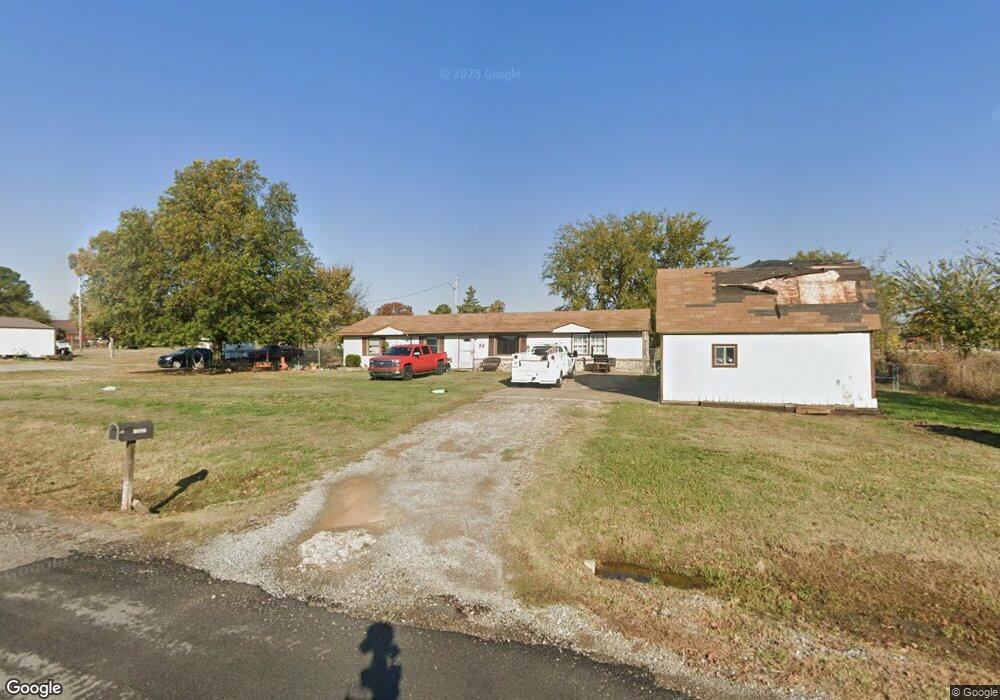
35625 W 36th St S Mannford, OK 74044
Estimated Value: $190,000 - $236,000
4
Beds
3
Baths
1,584
Sq Ft
$131/Sq Ft
Est. Value
About This Home
This home is located at 35625 W 36th St S, Mannford, OK 74044 and is currently estimated at $206,876, approximately $130 per square foot. 35625 W 36th St S is a home located in Creek County with nearby schools including Mannford Lower Elementary School, Mannford Upper Elementary School, and Mannford Middle School.
Ownership History
Date
Name
Owned For
Owner Type
Purchase Details
Closed on
Apr 6, 2011
Sold by
Beneficial Financial I Inc
Bought by
Danley Christopher D
Current Estimated Value
Home Financials for this Owner
Home Financials are based on the most recent Mortgage that was taken out on this home.
Original Mortgage
$98,439
Outstanding Balance
$69,324
Interest Rate
5.25%
Mortgage Type
FHA
Estimated Equity
$137,552
Purchase Details
Closed on
Mar 2, 2011
Sold by
Kitchingham William W and Kitchingham Kimberly L
Bought by
Beneficial Oklahoma Inc
Home Financials for this Owner
Home Financials are based on the most recent Mortgage that was taken out on this home.
Original Mortgage
$98,439
Outstanding Balance
$69,324
Interest Rate
5.25%
Mortgage Type
FHA
Estimated Equity
$137,552
Purchase Details
Closed on
Sep 3, 1999
Sold by
Warnke Ronald and Warnke Joyce
Purchase Details
Closed on
Nov 10, 1989
Create a Home Valuation Report for This Property
The Home Valuation Report is an in-depth analysis detailing your home's value as well as a comparison with similar homes in the area
Home Values in the Area
Average Home Value in this Area
Purchase History
| Date | Buyer | Sale Price | Title Company |
|---|---|---|---|
| Danley Christopher D | $101,000 | -- | |
| Beneficial Oklahoma Inc | $86,667 | -- | |
| -- | $62,000 | -- | |
| -- | $39,000 | -- |
Source: Public Records
Mortgage History
| Date | Status | Borrower | Loan Amount |
|---|---|---|---|
| Open | Danley Christopher D | $98,439 |
Source: Public Records
Tax History Compared to Growth
Tax History
| Year | Tax Paid | Tax Assessment Tax Assessment Total Assessment is a certain percentage of the fair market value that is determined by local assessors to be the total taxable value of land and additions on the property. | Land | Improvement |
|---|---|---|---|---|
| 2025 | $1,359 | $15,787 | $900 | $14,887 |
| 2024 | $1,359 | $15,328 | $900 | $14,428 |
| 2023 | $1,359 | $14,881 | $900 | $13,981 |
| 2022 | $1,232 | $14,448 | $900 | $13,548 |
| 2021 | $1,182 | $14,027 | $900 | $13,127 |
| 2020 | $1,180 | $13,619 | $900 | $12,719 |
| 2019 | $1,154 | $13,222 | $900 | $12,322 |
| 2018 | $1,153 | $12,837 | $900 | $11,937 |
| 2017 | $1,127 | $12,837 | $900 | $11,937 |
| 2016 | $1,120 | $12,837 | $900 | $11,937 |
| 2015 | -- | $12,837 | $900 | $11,937 |
| 2014 | -- | $12,644 | $900 | $11,744 |
Source: Public Records
Map
Nearby Homes
- 35459 W 36th St S
- 3042 State Highway 48
- 2122 S 353rd West Ave
- 34392 W 33rd Place S
- 38087 W 28th St S
- 33780 W 33rd Place S
- 2365 S 361st West Ave
- 2945 Sunset Rd
- 35846 Stone Creek Place
- 2464 S 369th West Ave
- 36516 Cramer Rd
- 4892 S 369th West Ave
- 35820 W Hwy 33
- 2950 S 385th West Ave
- 140 Glendale Cir
- 103 Dogwood
- 0 State Highway 48
- 152 Granada Dr
- 5433 S 385th West Ave
- 105 Hinton Blvd
- 3557 S 357th West Ave
- 35654 W 36th St S
- 35579 W 36th St S
- 35608 W 36th St S
- 3556 S 357th West Ave
- 3541 S 357th West Ave
- 35584 W 36th St S
- 3582 S 357th West Ave
- 3570 S 357th West Ave
- 3511 S 357th West Ave
- 3538 S 357th West Ave
- 3518 S 357th West Ave
- 3498 S 357th West Ave
- 3583 S 358th West Place
- 3561 S 358th West Place
- 3561 S 358th Place W
- 35804 W 36th St S
- 35442 W 36th St S
- 3511 S 358th West Place
- 35499 W 36th St S