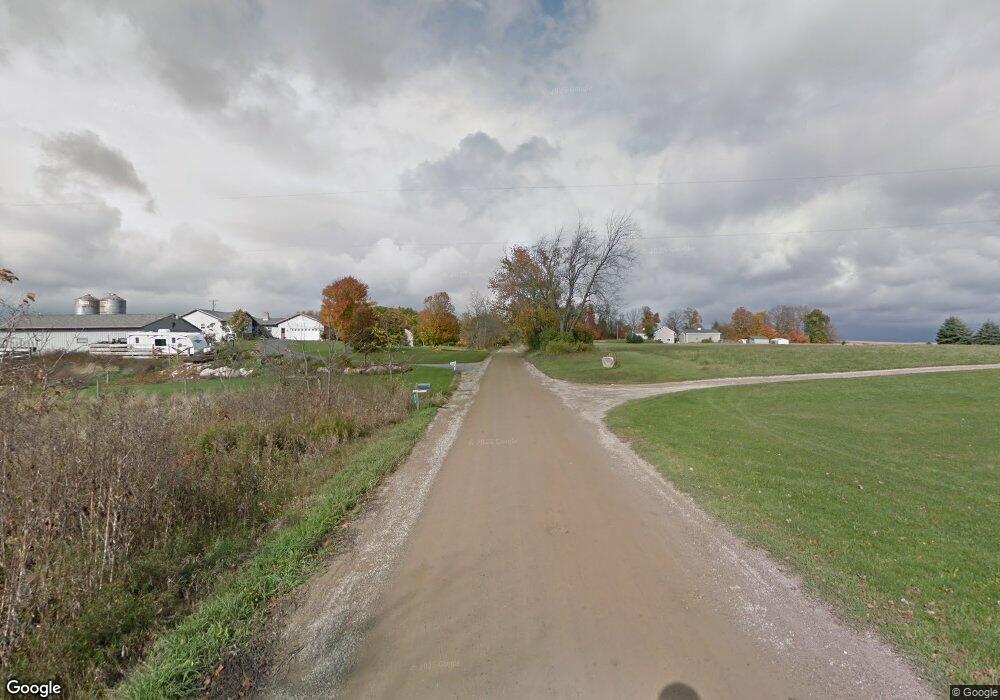
3563 6th St Wayland, MI 49348
Estimated Value: $463,801 - $580,000
3
Beds
2
Baths
1,562
Sq Ft
$323/Sq Ft
Est. Value
About This Home
This home is located at 3563 6th St, Wayland, MI 49348 and is currently estimated at $503,934, approximately $322 per square foot. 3563 6th St is a home located in Allegan County with nearby schools including Wayland High School and St. Therese Catholic School.
Ownership History
Date
Name
Owned For
Owner Type
Purchase Details
Closed on
Apr 2, 2009
Sold by
Griffith Crystal Dawn
Bought by
Griffith Robert William
Current Estimated Value
Create a Home Valuation Report for This Property
The Home Valuation Report is an in-depth analysis detailing your home's value as well as a comparison with similar homes in the area
Home Values in the Area
Average Home Value in this Area
Purchase History
| Date | Buyer | Sale Price | Title Company |
|---|---|---|---|
| Griffith Robert William | -- | None Available |
Source: Public Records
Tax History Compared to Growth
Tax History
| Year | Tax Paid | Tax Assessment Tax Assessment Total Assessment is a certain percentage of the fair market value that is determined by local assessors to be the total taxable value of land and additions on the property. | Land | Improvement |
|---|---|---|---|---|
| 2025 | $3,056 | $231,500 | $42,500 | $189,000 |
| 2024 | $2,660 | $234,800 | $44,000 | $190,800 |
| 2023 | $2,732 | $218,900 | $42,500 | $176,400 |
| 2022 | $2,660 | $193,900 | $23,000 | $170,900 |
| 2021 | $2,525 | $183,100 | $23,000 | $160,100 |
| 2020 | $2,458 | $185,000 | $21,000 | $164,000 |
| 2019 | $2,390 | $143,200 | $21,000 | $122,200 |
| 2018 | $2,340 | $131,100 | $26,300 | $104,800 |
| 2017 | $0 | $129,500 | $26,300 | $103,200 |
| 2016 | $0 | $116,900 | $25,300 | $91,600 |
| 2015 | -- | $116,900 | $25,300 | $91,600 |
| 2014 | -- | $105,100 | $22,700 | $82,400 |
| 2013 | -- | $85,300 | $22,700 | $62,600 |
Source: Public Records
Map
Nearby Homes
- 619 137th Ave
- 843 Wild Flower Ct
- 835 Wild Flower Ct
- 330 Lotz Ct
- 401 Anderson Dr
- 3214 7th St
- 3296 Stonehill Ct
- 3282 Stonehill Ct
- 3905 Sunset View
- 212 E Superior St
- 146 Hanlon Ct
- 516 131st Ave
- 110 E Sycamore St
- 545 N Main St
- 3770 Division Ave S
- 219 Alpine St
- 319 Alpine St
- 4007 2nd St
- 12857 Michael Dr Unit 49
- 12720 S Grey Ct