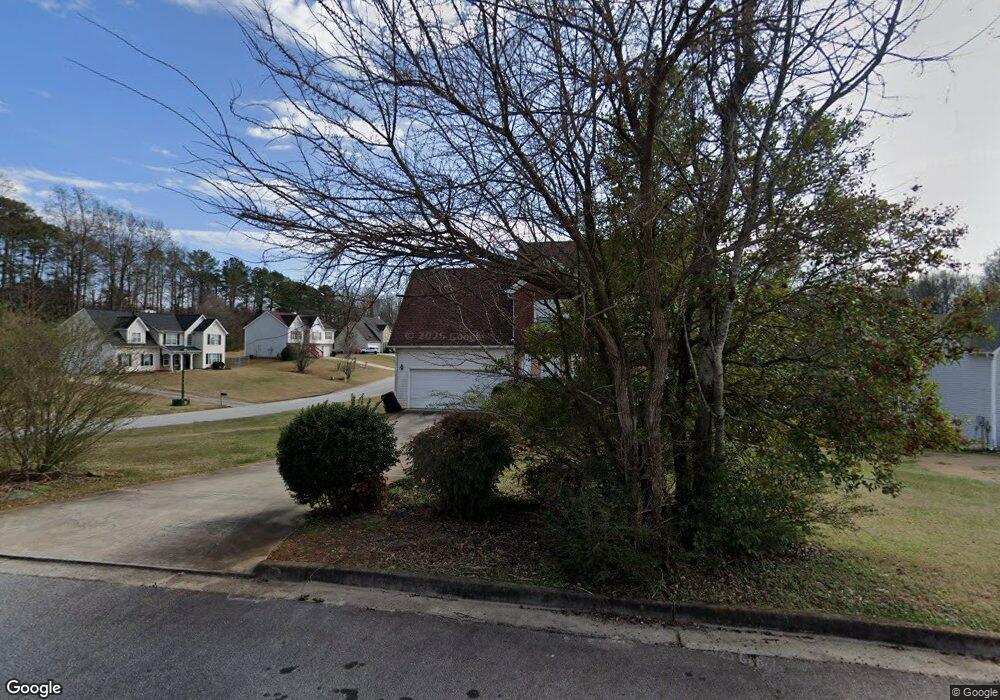
3565 Northgate Cove Unit 41 Ellenwood, GA 30294
Estimated Value: $316,371 - $372,000
4
Beds
3
Baths
2,292
Sq Ft
$147/Sq Ft
Est. Value
About This Home
This home is located at 3565 Northgate Cove Unit 41, Ellenwood, GA 30294 and is currently estimated at $337,843, approximately $147 per square foot. 3565 Northgate Cove Unit 41 is a home located in Clayton County with nearby schools including Anderson Elementary School, Adamson Middle School, and Morrow High School.
Ownership History
Date
Name
Owned For
Owner Type
Purchase Details
Closed on
Jun 17, 2016
Sold by
Sanders Danita D
Bought by
Sanders Danita D and Sanders Xavier Tarnon
Current Estimated Value
Home Financials for this Owner
Home Financials are based on the most recent Mortgage that was taken out on this home.
Original Mortgage
$142,373
Outstanding Balance
$114,408
Interest Rate
3.87%
Mortgage Type
FHA
Estimated Equity
$223,435
Purchase Details
Closed on
Aug 31, 2002
Sold by
German Joseph
Bought by
German Tiffany D J and German Joseph
Purchase Details
Closed on
Dec 6, 2000
Sold by
Walden Custom Homes Inc
Bought by
German Joseph
Home Financials for this Owner
Home Financials are based on the most recent Mortgage that was taken out on this home.
Original Mortgage
$142,000
Interest Rate
7.79%
Mortgage Type
New Conventional
Create a Home Valuation Report for This Property
The Home Valuation Report is an in-depth analysis detailing your home's value as well as a comparison with similar homes in the area
Home Values in the Area
Average Home Value in this Area
Purchase History
| Date | Buyer | Sale Price | Title Company |
|---|---|---|---|
| Sanders Danita D | -- | -- | |
| Sanders Danita D | $145,000 | -- | |
| German Tiffany D J | -- | -- | |
| German Joseph | $162,000 | -- |
Source: Public Records
Mortgage History
| Date | Status | Borrower | Loan Amount |
|---|---|---|---|
| Open | Sanders Danita D | $142,373 | |
| Closed | Sanders Danita D | $142,373 | |
| Previous Owner | German Joseph | $142,000 |
Source: Public Records
Tax History Compared to Growth
Tax History
| Year | Tax Paid | Tax Assessment Tax Assessment Total Assessment is a certain percentage of the fair market value that is determined by local assessors to be the total taxable value of land and additions on the property. | Land | Improvement |
|---|---|---|---|---|
| 2024 | $5,119 | $140,240 | $9,600 | $130,640 |
| 2023 | $4,421 | $122,440 | $9,600 | $112,840 |
| 2022 | $3,269 | $92,320 | $9,600 | $82,720 |
| 2021 | $2,386 | $69,440 | $9,600 | $59,840 |
| 2020 | $2,501 | $71,579 | $9,600 | $61,979 |
| 2019 | $2,427 | $68,854 | $9,600 | $59,254 |
| 2018 | $1,790 | $53,147 | $9,600 | $43,547 |
| 2017 | $1,906 | $55,912 | $9,600 | $46,312 |
| 2016 | $1,977 | $47,664 | $9,600 | $38,064 |
| 2015 | $1,523 | $0 | $0 | $0 |
| 2014 | $1,421 | $45,696 | $9,600 | $36,096 |
Source: Public Records
Map
Nearby Homes
- 4438 Northwind Dr
- 4489 Northwind Dr
- 4484 Northridge Trail
- 4283 Northwind Dr
- 3702 Upton Ct
- 3719 Upton Ct
- 823 Haydens Ridge
- 1012 Grace Marie Ln
- 3311 Rowden Rd
- 3289 Rowden Rd
- 856 Haydens Ridge
- 2621 Manor Place
- 226 Saul Dr
- 1501 Pineview Terrace
- 1236 Country Pine Dr
- 137 Solomon Dr
- 716 Habersham Ct
- 4139 Tilson Rd
- 1202 Palisades Ln
- 101 Solomon Dr
- 3565 Northgate Cove
- 3557 Northgate Cove
- 4425 Northwind Dr
- 4446 Northwind Dr
- 4457 Northwind Dr
- 4430 Northwind Dr
- 4454 Northwind Dr
- 3551 Northgate Cove
- 3554 Northgate Cove
- 4417 Northwind Dr
- 4422 Northwind Dr
- 4462 Northwind Dr
- 4475 Northwind Dr
- 3550 Northgate Cove
- 4470 Northwind Dr
- 4414 Northwind Dr
- 4409 Northwind Dr
- 4478 Northwind Dr
- 4756 Mitchells Ridge Dr
- 4905 Chatham Ct