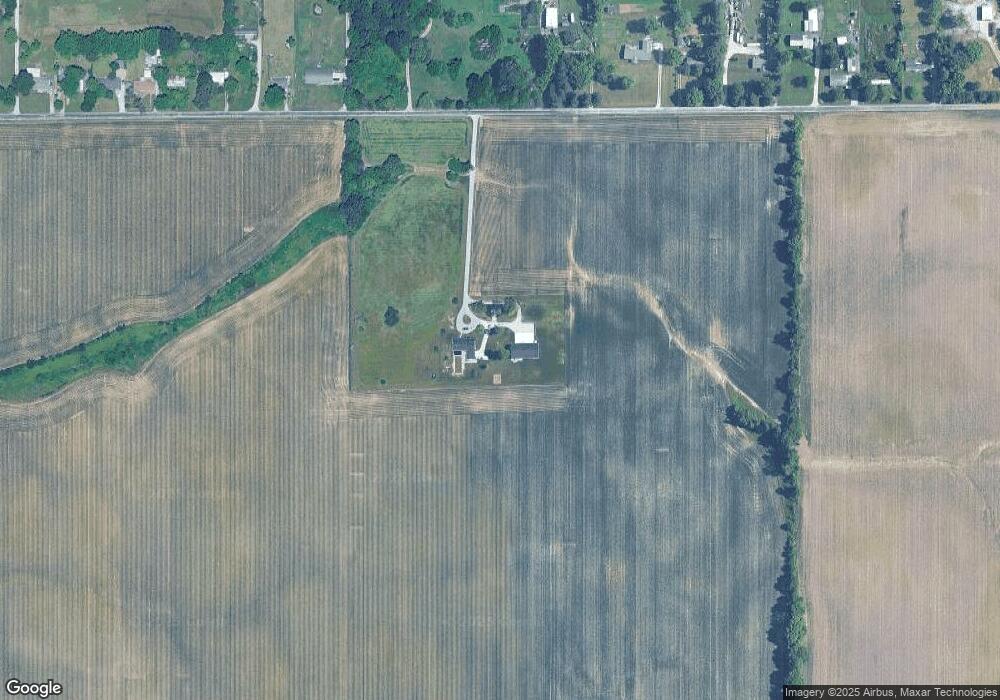
3567 E 950 S Markleville, IN 46056
Estimated Value: $549,797 - $608,000
Studio
5
Baths
2,968
Sq Ft
$195/Sq Ft
Est. Value
About This Home
This home is located at 3567 E 950 S, Markleville, IN 46056 and is currently estimated at $578,899, approximately $195 per square foot. 3567 E 950 S is a home located in Madison County with nearby schools including East Elementary School and Pendleton Heights Middle School.
Ownership History
Date
Name
Owned For
Owner Type
Purchase Details
Closed on
May 18, 2011
Sold by
Farm Credit Services Of Mid Averica
Bought by
Paugh John N
Current Estimated Value
Purchase Details
Closed on
Feb 18, 2011
Sold by
Simmons Wesley and Simmons Laura A
Bought by
Farm Credit Services Of Mid America Flca
Purchase Details
Closed on
Jul 25, 2009
Sold by
Simmons Wesley and Simmons Laura A
Bought by
Simmons Wesley
Purchase Details
Closed on
Aug 12, 2008
Sold by
Simmons Wesley
Bought by
Simmons Wesley and Simmons Laura A
Purchase Details
Closed on
Dec 28, 2005
Sold by
Young Madalene F
Bought by
Simmons Hensley G and Simmons Wesley
Home Financials for this Owner
Home Financials are based on the most recent Mortgage that was taken out on this home.
Original Mortgage
$288,750
Interest Rate
6.4%
Mortgage Type
Purchase Money Mortgage
Create a Home Valuation Report for This Property
The Home Valuation Report is an in-depth analysis detailing your home's value as well as a comparison with similar homes in the area
Home Values in the Area
Average Home Value in this Area
Purchase History
| Date | Buyer | Sale Price | Title Company |
|---|---|---|---|
| Paugh John N | -- | -- | |
| Farm Credit Services Of Mid America Flca | $591,335 | -- | |
| Simmons Wesley | -- | -- | |
| Simmons Wesley | -- | -- | |
| Simmons Hensley G | -- | -- |
Source: Public Records
Mortgage History
| Date | Status | Borrower | Loan Amount |
|---|---|---|---|
| Previous Owner | Simmons Hensley G | $288,750 |
Source: Public Records
Tax History
| Year | Tax Paid | Tax Assessment Tax Assessment Total Assessment is a certain percentage of the fair market value that is determined by local assessors to be the total taxable value of land and additions on the property. | Land | Improvement |
|---|---|---|---|---|
| 2025 | $2,655 | $324,800 | $29,700 | $295,100 |
| 2024 | $2,655 | $299,900 | $30,400 | $269,500 |
| 2023 | $3,197 | $278,600 | $27,800 | $250,800 |
| 2022 | $3,198 | $280,100 | $26,200 | $253,900 |
| 2021 | $2,965 | $257,100 | $25,300 | $231,800 |
| 2020 | $2,196 | $217,500 | $24,600 | $192,900 |
| 2019 | $2,422 | $229,400 | $25,700 | $203,700 |
| 2018 | $2,437 | $223,900 | $25,900 | $198,000 |
| 2017 | $2,338 | $213,100 | $25,900 | $187,200 |
| 2016 | $2,415 | $218,800 | $27,800 | $191,000 |
| 2014 | $2,406 | $218,600 | $28,100 | $190,500 |
| 2013 | $2,406 | $211,100 | $26,700 | $184,400 |
Source: Public Records
Map
Nearby Homes
- 9292 S Tomahawk Trail
- 0 E 575 S Unit MBR22077517
- 0 E 575 S Unit 26127953
- 0 E 575 S Unit 11621534
- 20 E Main St
- 119 W Main St
- 2411 E State Road 38
- 8202 S 300 E
- 8092 S 300 E
- 8847 S State Road 109
- 4815 E 800 S
- 00 W 100 Rd N
- 0 N Mechanicsburg Rd
- 01 W 100 Rd N
- 9733 N 775 E
- 9124 W Wren Way
- 5634 N Quail Ln
- 115 W State Road 38
- 6416 S County Road 100 E
- 0 N Nashville Rd Unit MBR22064069
Your Personal Tour Guide
Ask me questions while you tour the home.