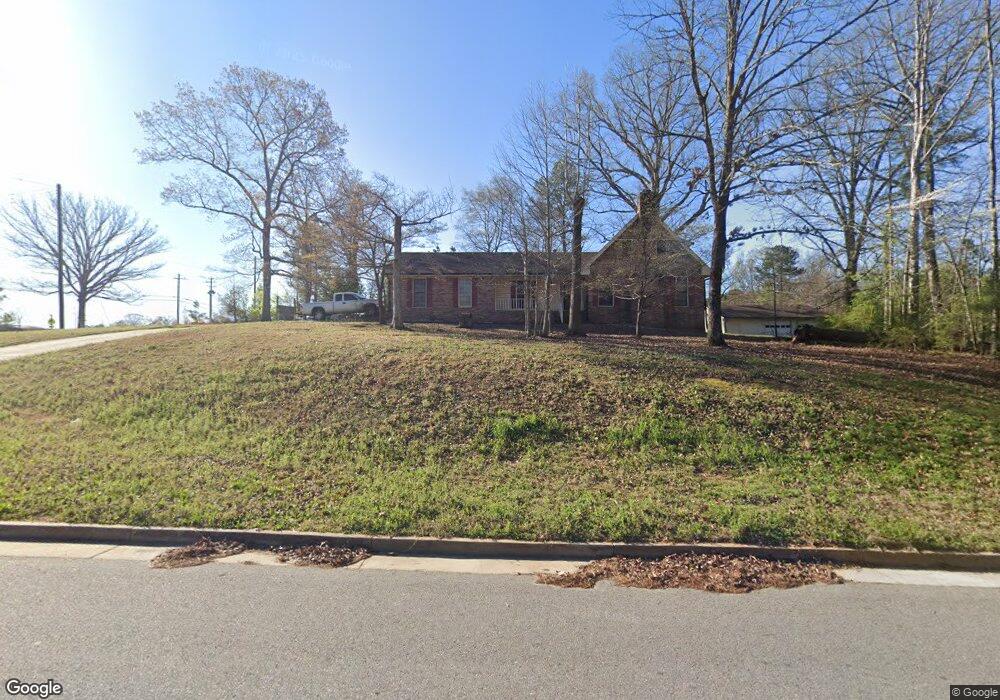
3567 Overland Trail Ellenwood, GA 30294
Estimated Value: $250,000 - $297,000
3
Beds
3
Baths
1,599
Sq Ft
$176/Sq Ft
Est. Value
About This Home
This home is located at 3567 Overland Trail, Ellenwood, GA 30294 and is currently estimated at $281,236, approximately $175 per square foot. 3567 Overland Trail is a home located in Clayton County with nearby schools including East Clayton Elementary School, Adamson Middle School, and Morrow High School.
Ownership History
Date
Name
Owned For
Owner Type
Purchase Details
Closed on
Nov 30, 2010
Sold by
Veterans Admn
Bought by
Hines Keith
Current Estimated Value
Home Financials for this Owner
Home Financials are based on the most recent Mortgage that was taken out on this home.
Original Mortgage
$60,090
Outstanding Balance
$1,351
Interest Rate
4.3%
Mortgage Type
FHA
Estimated Equity
$279,885
Purchase Details
Closed on
Apr 6, 2010
Sold by
Wells Fargo Bk Na
Bought by
Veterans Admn
Purchase Details
Closed on
Oct 26, 2005
Sold by
Williams Craig H and Williams Brenda
Bought by
Bloodsaw Stanley
Purchase Details
Closed on
Oct 3, 2002
Sold by
Cates William F and Cates Diane W
Bought by
Williams Craig H and Williams Brenda
Home Financials for this Owner
Home Financials are based on the most recent Mortgage that was taken out on this home.
Original Mortgage
$183,498
Interest Rate
6.21%
Mortgage Type
VA
Create a Home Valuation Report for This Property
The Home Valuation Report is an in-depth analysis detailing your home's value as well as a comparison with similar homes in the area
Home Values in the Area
Average Home Value in this Area
Purchase History
| Date | Buyer | Sale Price | Title Company |
|---|---|---|---|
| Hines Keith | $60,900 | -- | |
| Veterans Admn | -- | -- | |
| Wells Fargo Bk Na | $57,285 | -- | |
| Bloodsaw Stanley | $34,000 | -- | |
| Williams Craig H | $179,900 | -- | |
| Williams Craig H | -- | -- |
Source: Public Records
Mortgage History
| Date | Status | Borrower | Loan Amount |
|---|---|---|---|
| Open | Hines Keith | $60,090 | |
| Previous Owner | Williams Craig H | $183,498 |
Source: Public Records
Tax History Compared to Growth
Tax History
| Year | Tax Paid | Tax Assessment Tax Assessment Total Assessment is a certain percentage of the fair market value that is determined by local assessors to be the total taxable value of land and additions on the property. | Land | Improvement |
|---|---|---|---|---|
| 2024 | $3,221 | $107,480 | $8,800 | $98,680 |
| 2023 | $3,862 | $106,960 | $8,800 | $98,160 |
| 2022 | $2,877 | $82,120 | $8,800 | $73,320 |
| 2021 | $2,665 | $66,280 | $8,800 | $57,480 |
| 2020 | $2,794 | $68,676 | $8,800 | $59,876 |
| 2019 | $2,767 | $67,000 | $6,400 | $60,600 |
| 2018 | $2,796 | $67,722 | $6,400 | $61,322 |
| 2017 | $2,148 | $51,634 | $6,400 | $45,234 |
| 2016 | $1,962 | $47,074 | $6,400 | $40,674 |
| 2015 | $1,948 | $0 | $0 | $0 |
| 2014 | $1,809 | $44,304 | $6,400 | $37,904 |
Source: Public Records
Map
Nearby Homes
- 3719 Jackson Ln Unit 1
- 3357 Bonnes Ct
- 3485 Saddle Creek Ln Unit 1
- 5284 Benjamin Trail
- 3491 Saddle Creek Ln Unit 1
- 2064 Panola Rd
- 5210 Katherine Village Dr
- 5513 Emily Cir
- 4637 Bouldercrest Rd
- 3719 Upton Ct
- 5514 Frontier Ct
- 3702 Upton Ct
- 3720 Laramie Rd
- 274 Bowden Rd
- 4489 Northwind Dr
- 3587 Arminto Dr
- 3689 Fremont Dr
- 137 Solomon Dr
- 5578 Swanson Rd
- 5041 Stagecoach Rd
- 3553 Overland Trail
- 5049 Stagecoach Rd
- 3572 Overland Trail
- 0 Overland Trail Unit 8250353
- 0 Overland Trail Unit 8048674
- 0 Overland Trail Unit 3208571
- 0 Overland Trail Unit 3276869
- 3506 Overland Trail
- 3558 Overland Trail
- 3546 Overland Trail
- 0 Steele Rd Unit 7502855
- 0 Steele Rd Unit 7336537
- 0 Steele Rd
- 3539 Overland Trail Unit 1
- 5081 Stagecoach Rd
- 5099 Steele Rd
- 3585 Rolling Meadows Dr
- 3534 Overland Trail
- 3599 Rolling Meadows Dr