3569 E Reno Ave Las Vegas, NV 89120
Paradise Valley East NeighborhoodEstimated Value: $474,412 - $557,000
4
Beds
3
Baths
2,341
Sq Ft
$217/Sq Ft
Est. Value
About This Home
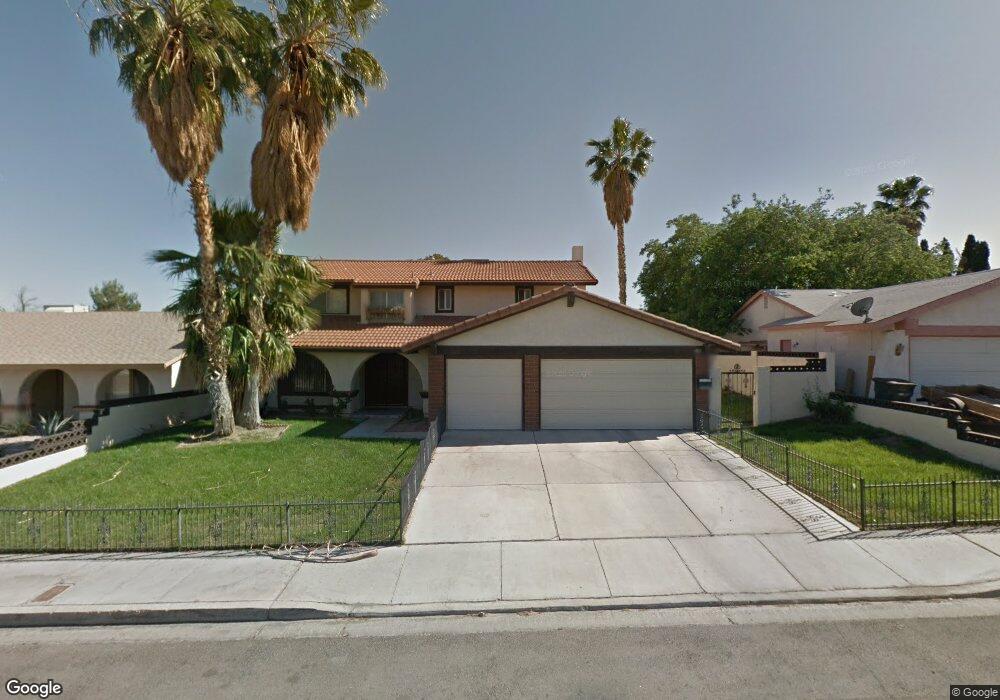
This home is located at 3569 E Reno Ave, Las Vegas, NV 89120 and is currently estimated at $507,103, approximately $216 per square foot. 3569 E Reno Ave is a home located in Clark County with nearby schools including Doris French Elementary School, Helen C. Cannon Junior High School, and Del Sol Academy of the Performing Arts.
Ownership History
Date
Name
Owned For
Owner Type
Purchase Details
Closed on
Sep 7, 2021
Sold by
Cooper Robert P
Bought by
Cooper Robert P
Current Estimated Value
Home Financials for this Owner
Home Financials are based on the most recent Mortgage that was taken out on this home.
Original Mortgage
$100,000
Outstanding Balance
$63,320
Interest Rate
2.8%
Mortgage Type
New Conventional
Estimated Equity
$443,783
Purchase Details
Closed on
Jul 23, 2002
Sold by
Zaragoza Genoveva D
Bought by
Cooper Robert P and Roder Cynthia L
Home Financials for this Owner
Home Financials are based on the most recent Mortgage that was taken out on this home.
Original Mortgage
$185,640
Interest Rate
6.6%
Mortgage Type
VA
Purchase Details
Closed on
Dec 9, 1993
Sold by
Zaragoza Genoveva D
Bought by
Zaragoza Genoveva D
Home Financials for this Owner
Home Financials are based on the most recent Mortgage that was taken out on this home.
Original Mortgage
$69,500
Interest Rate
7.2%
Create a Home Valuation Report for This Property
The Home Valuation Report is an in-depth analysis detailing your home's value as well as a comparison with similar homes in the area
Home Values in the Area
Average Home Value in this Area
Purchase History
| Date | Buyer | Sale Price | Title Company |
|---|---|---|---|
| Cooper Robert P | -- | Lawyers Title Henderson | |
| Cooper Robert P | $182,000 | Land Title | |
| Zaragoza Genoveva D | -- | United Title |
Source: Public Records
Mortgage History
| Date | Status | Borrower | Loan Amount |
|---|---|---|---|
| Open | Cooper Robert P | $100,000 | |
| Closed | Cooper Robert P | $185,640 | |
| Previous Owner | Zaragoza Genoveva D | $69,500 |
Source: Public Records
Tax History Compared to Growth
Tax History
| Year | Tax Paid | Tax Assessment Tax Assessment Total Assessment is a certain percentage of the fair market value that is determined by local assessors to be the total taxable value of land and additions on the property. | Land | Improvement |
|---|---|---|---|---|
| 2025 | $1,535 | $79,413 | $35,000 | $44,413 |
| 2024 | $1,491 | $79,413 | $35,000 | $44,413 |
| 2023 | $1,216 | $84,190 | $40,600 | $43,590 |
| 2022 | $1,448 | $70,333 | $29,750 | $40,583 |
| 2021 | $1,405 | $66,133 | $26,950 | $39,183 |
| 2020 | $1,362 | $63,936 | $24,500 | $39,436 |
| 2019 | $1,322 | $61,871 | $22,400 | $39,471 |
| 2018 | $1,283 | $57,831 | $19,600 | $38,231 |
| 2017 | $1,703 | $58,063 | $18,900 | $39,163 |
| 2016 | $1,216 | $53,763 | $13,650 | $40,113 |
| 2015 | $1,213 | $43,393 | $10,150 | $33,243 |
| 2014 | $1,177 | $38,953 | $8,750 | $30,203 |
Source: Public Records
Map
Nearby Homes
- 3671 Villa Knolls Dr E
- 3683 Villa Knolls Dr S
- 3668 Villa Knolls Dr S
- 3441 Villa Way
- 3435 Villa Knolls Dr S
- 5145 Tennis Ct E
- 3485 Shamrock Ave
- 5102 Tennis Ct E
- 3480 E Hacienda Ave
- 3703 Casey Dr
- 3690 La Junta Dr
- 5141 Shadow Hill Dr
- 3434 Toquima Cir
- 5322 Runningbrook Rd
- 5255 S Sandhill Rd
- 5398 Lamoille Cir
- 5397 Lamoille Cir
- 5342 Runningbrook Rd
- 3416 Brittlewood Ave
- 5211 Caspian Springs Dr Unit 201
- 3559 E Reno Ave
- 3579 E Reno Ave
- 5143 Richmond Cir
- 5132 Richmond Cir
- 3549 E Reno Ave
- 3589 E Reno Ave
- 3675 Villa Knolls East Dr
- 3679 Villa Knolls East Dr
- 3671 Villa Knolls East Dr
- 5144 Ladera Cir
- 3683 Villa Knolls East Dr Unit 4
- 3673 Villa Knolls Dr E
- 3673 Villa Knolls Dr E Unit None
- 3673 Villa Knolls East Dr
- 5144 Richmond Cir
- 3677 Villa Knolls East Dr
- 3669 Villa Knolls East Dr
- 3681 Villa Knolls East Dr
- 5155 Richmond Cir