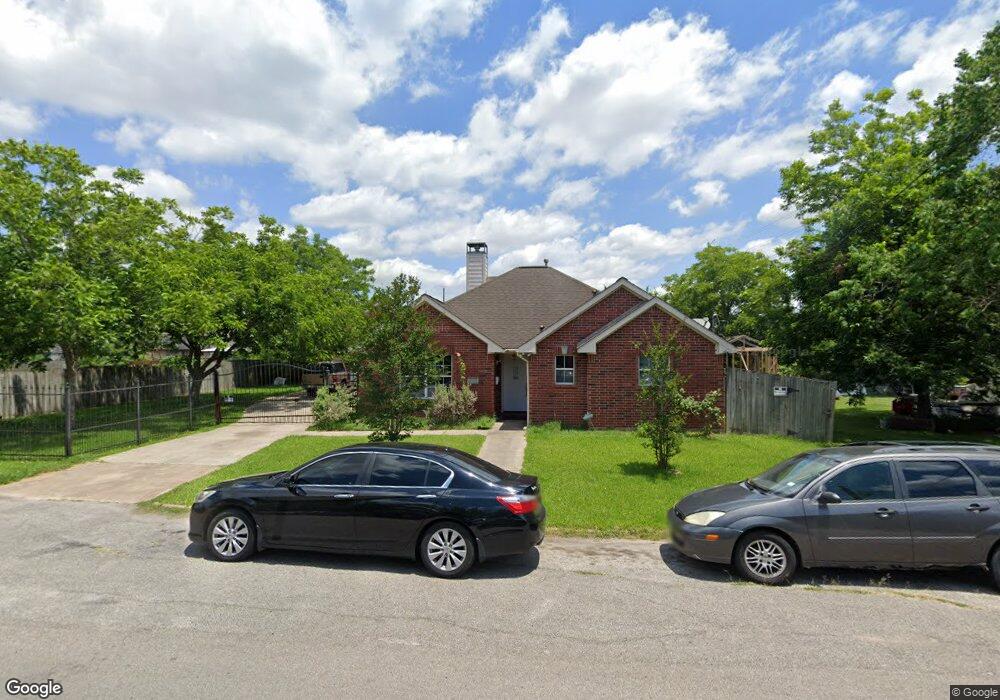
3569 Seabrook St Houston, TX 77021
OST-South Union NeighborhoodEstimated Value: $257,000 - $320,000
3
Beds
2
Baths
1,576
Sq Ft
$186/Sq Ft
Est. Value
About This Home
This home is located at 3569 Seabrook St, Houston, TX 77021 and is currently estimated at $292,873, approximately $185 per square foot. 3569 Seabrook St is a home located in Harris County with nearby schools including Whidby Elementary School, Cullen Middle School, and Yates High School.
Ownership History
Date
Name
Owned For
Owner Type
Purchase Details
Closed on
Aug 15, 2017
Sold by
Flanagar Elmo
Bought by
Neamons Charles J
Current Estimated Value
Home Financials for this Owner
Home Financials are based on the most recent Mortgage that was taken out on this home.
Original Mortgage
$80,000
Outstanding Balance
$66,754
Interest Rate
3.96%
Mortgage Type
Purchase Money Mortgage
Estimated Equity
$226,119
Create a Home Valuation Report for This Property
The Home Valuation Report is an in-depth analysis detailing your home's value as well as a comparison with similar homes in the area
Home Values in the Area
Average Home Value in this Area
Purchase History
| Date | Buyer | Sale Price | Title Company |
|---|---|---|---|
| Neamons Charles J | -- | Stewart Title |
Source: Public Records
Mortgage History
| Date | Status | Borrower | Loan Amount |
|---|---|---|---|
| Open | Neamons Charles J | $80,000 |
Source: Public Records
Tax History Compared to Growth
Tax History
| Year | Tax Paid | Tax Assessment Tax Assessment Total Assessment is a certain percentage of the fair market value that is determined by local assessors to be the total taxable value of land and additions on the property. | Land | Improvement |
|---|---|---|---|---|
| 2025 | $6,529 | $327,902 | $180,000 | $147,902 |
| 2024 | $6,529 | $324,027 | $165,000 | $159,027 |
| 2023 | $6,529 | $327,027 | $157,500 | $169,527 |
| 2022 | $4,594 | $282,827 | $135,000 | $147,827 |
| 2021 | $4,420 | $215,492 | $82,500 | $132,992 |
| 2020 | $4,175 | $198,771 | $50,625 | $148,146 |
| 2019 | $3,966 | $176,646 | $39,375 | $137,271 |
| 2018 | $2,294 | $142,496 | $33,750 | $108,746 |
| 2017 | $3,445 | $142,496 | $33,750 | $108,746 |
| 2016 | $3,131 | $123,840 | $22,500 | $101,340 |
| 2015 | -- | $123,840 | $22,500 | $101,340 |
| 2014 | -- | $123,840 | $22,500 | $101,340 |
Source: Public Records
Map
Nearby Homes
- 3550 Mount Pleasant St
- 3544 Mount Pleasant St
- 3555 Noah St
- 3545 Mount Pleasant St Unit A&B
- 3617 Mount Pleasant St
- 3603 Mount Pleasant St
- 3615 Seabrook St
- 7229 Tierwester St
- 3605 Mount Pleasant St
- 7225 Tierwester St
- 3550 Nathaniel Brown St
- 3623 Nathaniel Brown St
- 3552 Nathaniel Brown St
- 3620 Mount Pleasant St
- 3628 Seabrook St
- 3630 Seabrook St
- 3617 Mainer St Unit A/B
- 3620 Corder St
- 3638 Nathaniel Brown St
- 3533 Lydia St
- 3559 Seabrook St
- 3577 Seabrook St
- 3564 Mount Pleasant St
- 3562 Mount Pleasant St
- 3558 Mount Pleasant St
- 3568 Seabrook St
- 3551 Seabrook St
- 3554 Mount Pleasant St
- 3546 Seabrook St
- 0 Seabrook St
- 3552 Seabrook St
- 3545 Seabrook St
- 3548 Seabrook
- 3571 Noah St
- 3561 Noah St
- 3567 Mount Pleasant St
- 3567 Mount Pleasant St
- 3559 Noah St
- 3557 Seabrook St
- 3603 Seabrook St