Estimated Value: $412,169 - $450,000
3
Beds
1
Bath
1,016
Sq Ft
$428/Sq Ft
Est. Value
About This Home
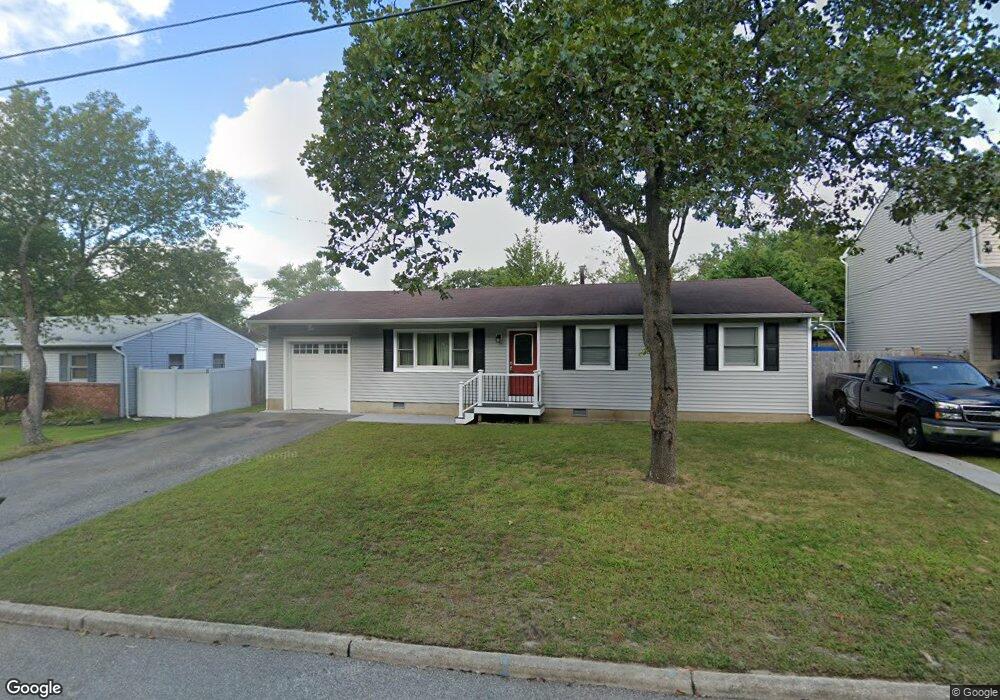
This home is located at 357 16th Ave, Brick, NJ 08724 and is currently estimated at $435,292, approximately $428 per square foot. 357 16th Ave is a home located in Ocean County with nearby schools including Veterans Memorial Elementary School, Veterans Memorial Middle School, and Brick Township Memorial High School.
Ownership History
Date
Name
Owned For
Owner Type
Purchase Details
Closed on
Aug 3, 2006
Sold by
Yezo Ann and Cantillo Rhonda
Bought by
Gaquer Maurice
Current Estimated Value
Home Financials for this Owner
Home Financials are based on the most recent Mortgage that was taken out on this home.
Original Mortgage
$246,100
Outstanding Balance
$207,130
Interest Rate
7.87%
Mortgage Type
Purchase Money Mortgage
Estimated Equity
$228,162
Create a Home Valuation Report for This Property
The Home Valuation Report is an in-depth analysis detailing your home's value as well as a comparison with similar homes in the area
Home Values in the Area
Average Home Value in this Area
Purchase History
| Date | Buyer | Sale Price | Title Company |
|---|---|---|---|
| Gaquer Maurice | $259,100 | First American Title Ins Co |
Source: Public Records
Mortgage History
| Date | Status | Borrower | Loan Amount |
|---|---|---|---|
| Open | Gaquer Maurice | $246,100 |
Source: Public Records
Tax History
| Year | Tax Paid | Tax Assessment Tax Assessment Total Assessment is a certain percentage of the fair market value that is determined by local assessors to be the total taxable value of land and additions on the property. | Land | Improvement |
|---|---|---|---|---|
| 2025 | $5,376 | $195,500 | $126,000 | $69,500 |
| 2024 | $4,860 | $195,500 | $126,000 | $69,500 |
| 2023 | $4,796 | $195,500 | $126,000 | $69,500 |
| 2022 | $4,796 | $195,500 | $126,000 | $69,500 |
| 2021 | $4,687 | $195,500 | $126,000 | $69,500 |
| 2020 | $4,633 | $195,500 | $126,000 | $69,500 |
| 2019 | $4,543 | $195,500 | $126,000 | $69,500 |
| 2018 | $4,440 | $195,500 | $126,000 | $69,500 |
| 2017 | $4,321 | $195,500 | $126,000 | $69,500 |
| 2016 | $4,289 | $195,500 | $126,000 | $69,500 |
| 2015 | $4,501 | $210,700 | $140,000 | $70,700 |
| 2014 | $4,135 | $195,500 | $126,000 | $69,500 |
Source: Public Records
Map
Nearby Homes
- 295 Madison Ct
- 22 Cedar Village Blvd
- 8 Cedar Village Blvd
- 432 18th Ave
- 506 Azalea Dr
- 449 Ann Ave
- 441 17th Ave
- 178 Calvin Ct
- 506 Godfrey Lake Dr
- 726 Maple Ave
- 339 Prospect Dr
- 257 Riverside Dr N
- 823 Maple Ave
- 505 5th Ave
- 151 Riverside Dr N
- 869 Koches Ave Unit 18
- 121 Harding Dr
- 124 Roosevelt Dr
- 143 Beverly Blvd
- 550 Crestview Terrace
Your Personal Tour Guide
Ask me questions while you tour the home.