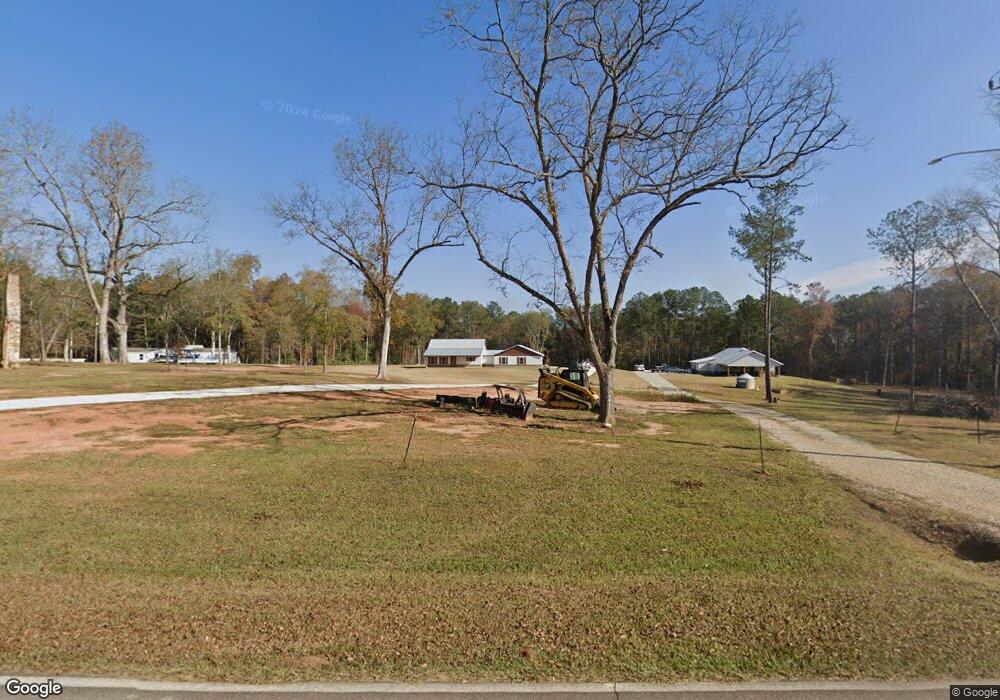
357 Baughs Cross Rd West Point, GA 31833
Estimated Value: $242,000 - $306,372
2
Beds
2
Baths
1,742
Sq Ft
$157/Sq Ft
Est. Value
About This Home
This home is located at 357 Baughs Cross Rd, West Point, GA 31833 and is currently estimated at $273,843, approximately $157 per square foot. 357 Baughs Cross Rd is a home located in Troup County with nearby schools including Long Cane Elementary School, West Point Elementary School, and Whitesville Road Elementary School.
Ownership History
Date
Name
Owned For
Owner Type
Purchase Details
Closed on
Nov 24, 2020
Sold by
Hester Alan M
Bought by
Benefield Charles and Benefield Alicia I
Current Estimated Value
Purchase Details
Closed on
Dec 3, 2001
Sold by
Dorothy M Clay
Bought by
Hester Alan M and Hester Linda
Purchase Details
Closed on
Nov 7, 1983
Sold by
Dorothy M Clay
Bought by
Dorothy M Clay
Purchase Details
Closed on
Sep 27, 1983
Sold by
Ada D Harris Ext To S Samual
Bought by
Dorothy M Clay
Purchase Details
Closed on
Sep 26, 1983
Sold by
John Luther Waldroup
Bought by
Ada D Harris Ext To S Samual
Purchase Details
Closed on
Jan 1, 1943
Bought by
John Luther Waldroup
Purchase Details
Closed on
Dec 1, 1939
Sold by
Henry Reeves
Purchase Details
Closed on
Nov 17, 1928
Sold by
Citizen Bank & Trust
Bought by
Henry Reeves
Create a Home Valuation Report for This Property
The Home Valuation Report is an in-depth analysis detailing your home's value as well as a comparison with similar homes in the area
Home Values in the Area
Average Home Value in this Area
Purchase History
| Date | Buyer | Sale Price | Title Company |
|---|---|---|---|
| Benefield Charles | $54,000 | -- | |
| Hester Alan M | $16,000 | -- | |
| Dorothy M Clay | -- | -- | |
| Dorothy M Clay | $17,000 | -- | |
| Ada D Harris Ext To S Samual | $17,000 | -- | |
| John Luther Waldroup | -- | -- | |
| -- | -- | -- | |
| Henry Reeves | -- | -- |
Source: Public Records
Tax History Compared to Growth
Tax History
| Year | Tax Paid | Tax Assessment Tax Assessment Total Assessment is a certain percentage of the fair market value that is determined by local assessors to be the total taxable value of land and additions on the property. | Land | Improvement |
|---|---|---|---|---|
| 2024 | $2,168 | $89,440 | $13,240 | $76,200 |
| 2023 | $1,978 | $82,480 | $13,240 | $69,240 |
| 2022 | $2,067 | $84,000 | $19,320 | $64,680 |
| 2021 | $631 | $20,920 | $20,160 | $760 |
| 2020 | $611 | $20,244 | $20,160 | $84 |
| 2019 | $611 | $20,260 | $20,160 | $100 |
| 2018 | $611 | $20,248 | $20,160 | $88 |
| 2017 | $611 | $20,248 | $20,160 | $88 |
| 2016 | $611 | $20,274 | $20,174 | $100 |
| 2015 | $612 | $20,274 | $20,174 | $100 |
| 2014 | $614 | $20,274 | $20,174 | $100 |
| 2013 | -- | $20,274 | $20,174 | $100 |
Source: Public Records
Map
Nearby Homes
- 208 Harris Walk Unit 80
- 311 Tomme Rd
- 4172 Bartley Rd
- 648 Warner Rd
- 1550 Baughs Cross Rd
- 2067 Bartley Rd
- 333 Shoemaker Rd
- 143 W Drummond Rd
- 151 W Drummond Rd
- 157 W Drummond Rd
- 137 W Drummond Rd
- 131 W Drummond Rd
- 0 Cannonville Rd
- 1605 Bartley Rd
- 0 Johns Rd Unit 10615130
- 0 Sandtown Rd Unit 10255987
- Sandtown Road Unit: 1 2+ - Acre
- 797 Gabbettville Rd
- 345 Robert Taylor Rd
- 3913 Whitesville Rd
- 422 Baughs Cross Rd
- 333 Baughs Cross Rd
- 385 Baughs Cross Rd
- 403 Gray Hill Rd
- 389 Gray Hill Rd
- 304 Baughs Cross Rd
- 462 Baughs Cross Rd
- 289 Baughs Cross Rd
- 292 Baughs Cross Rd
- 375 Gray Hill Rd
- 8 Waldroup Rd
- 282 Baughs Cross Rd
- 413 Baughs Cross Rd
- 361 Gray Hill Rd
- 347 Gray Hill Rd
- 249 Baughs Cross Rd
- 228 Baughs Cross Rd
- 56 Waldroup Rd
- 577 Baughs Cross Rd
- 95 Waldroup Rd