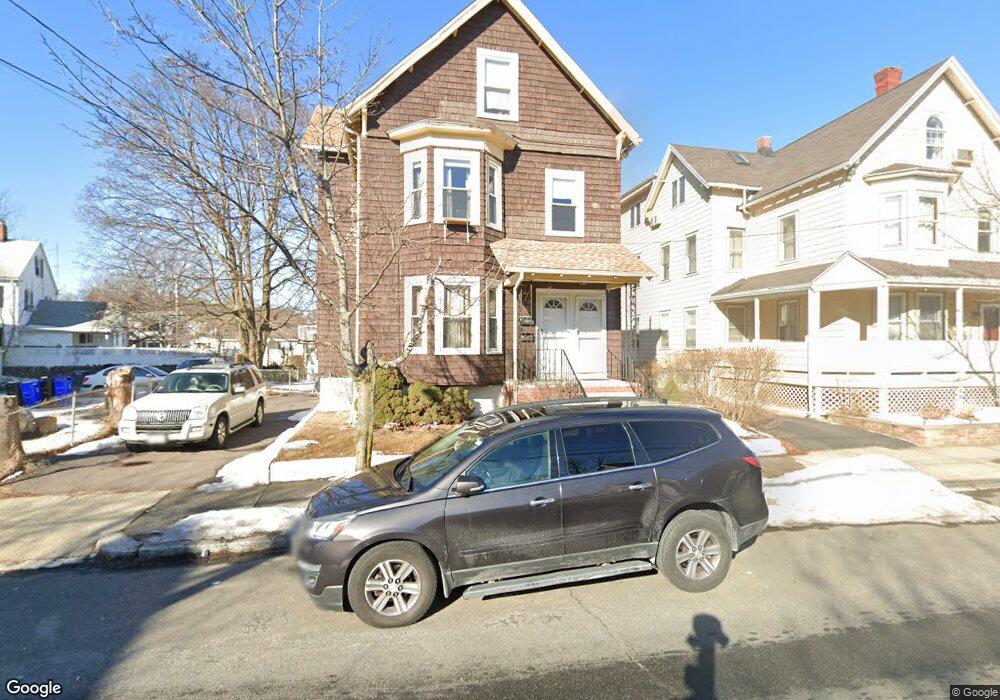
357 Charles St Unit 357A Malden, MA 02148
West End NeighborhoodEstimated Value: $909,023 - $1,222,000
6
Beds
3
Baths
2,391
Sq Ft
$431/Sq Ft
Est. Value
About This Home
This home is located at 357 Charles St Unit 357A, Malden, MA 02148 and is currently estimated at $1,029,756, approximately $430 per square foot. 357 Charles St Unit 357A is a home located in Middlesex County with nearby schools including Malden High School, Mystic Valley Regional Charter School, and Cheverus Catholic School.
Ownership History
Date
Name
Owned For
Owner Type
Purchase Details
Closed on
Mar 14, 2011
Sold by
Idrissi Habiba
Bought by
Malden City Of
Current Estimated Value
Purchase Details
Closed on
Jan 10, 2003
Sold by
Dhillon Jatinder
Bought by
Idrissi Habiba
Home Financials for this Owner
Home Financials are based on the most recent Mortgage that was taken out on this home.
Original Mortgage
$386,100
Interest Rate
6.19%
Mortgage Type
Purchase Money Mortgage
Purchase Details
Closed on
Mar 28, 2000
Sold by
Barletta John R
Bought by
Dhillon Jatinder
Home Financials for this Owner
Home Financials are based on the most recent Mortgage that was taken out on this home.
Original Mortgage
$242,725
Interest Rate
8.31%
Mortgage Type
Purchase Money Mortgage
Purchase Details
Closed on
Aug 1, 1995
Sold by
Barletta Joyce M
Bought by
Barletta John R
Create a Home Valuation Report for This Property
The Home Valuation Report is an in-depth analysis detailing your home's value as well as a comparison with similar homes in the area
Home Values in the Area
Average Home Value in this Area
Purchase History
| Date | Buyer | Sale Price | Title Company |
|---|---|---|---|
| Malden City Of | $814 | -- | |
| Idrissi Habiba | $429,000 | -- | |
| Dhillon Jatinder | $255,500 | -- | |
| Barletta John R | $50,000 | -- | |
| Barletta John R | $50,000 | -- |
Source: Public Records
Mortgage History
| Date | Status | Borrower | Loan Amount |
|---|---|---|---|
| Previous Owner | Barletta John R | $16,000 | |
| Previous Owner | Idrissi Habiba | $386,100 | |
| Previous Owner | Barletta John R | $242,725 | |
| Previous Owner | Barletta John R | $35,000 |
Source: Public Records
Tax History Compared to Growth
Tax History
| Year | Tax Paid | Tax Assessment Tax Assessment Total Assessment is a certain percentage of the fair market value that is determined by local assessors to be the total taxable value of land and additions on the property. | Land | Improvement |
|---|---|---|---|---|
| 2025 | $90 | $793,100 | $284,500 | $508,600 |
| 2024 | $8,724 | $746,300 | $268,700 | $477,600 |
| 2023 | $8,448 | $693,000 | $245,000 | $448,000 |
| 2022 | $8,088 | $654,900 | $221,200 | $433,700 |
| 2021 | $7,757 | $631,200 | $197,500 | $433,700 |
| 2020 | $7,518 | $594,300 | $190,800 | $403,500 |
| 2019 | $7,008 | $528,100 | $181,700 | $346,400 |
| 2018 | $6,724 | $477,200 | $150,100 | $327,100 |
| 2017 | $6,460 | $455,900 | $144,200 | $311,700 |
| 2016 | $5,838 | $385,100 | $132,400 | $252,700 |
| 2015 | $5,649 | $359,100 | $126,000 | $233,100 |
| 2014 | $5,319 | $330,400 | $114,600 | $215,800 |
Source: Public Records
Map
Nearby Homes
- 38-40 Russell St
- 10 Prospect Terrace
- 149 Pearl St
- 394-396 Pleasant St
- 84 Fellsway E
- 1 Dexter St Unit 5
- 112 Maple St Unit 6
- 500 Salem St Unit 304
- 500 Salem St Unit 708
- 108 Highland Ave
- 55 Surrey St
- 35 Fells Avenue Terrace
- 95 Maple St Unit 18
- 74 Highland Ave
- 216 Central Ave Unit 218
- 17 Raymond St
- 87 Cedar St Unit 10
- 307-309 Clifton St
- 11 Girard Rd
- 55 Evans St
- 357 Charles St Unit 1
- 353 Charles St
- 349 Charles St
- 361-365 Charles St Unit 86
- 361 Charles St
- 360 Charles St Unit 12
- 360 Charles St Unit 11
- 360 Charles St Unit 10
- 360 Charles St Unit 9
- 360 Charles St Unit 8
- 360 Charles St Unit 7
- 360 Charles St Unit 6
- 360 Charles St Unit 5
- 360 Charles St Unit 4
- 360 Charles St Unit 3
- 360 Charles St Unit 2
- 360 Charles St Unit 1
- 360 Charles St
- 86 West St
- 86 West St Unit 86