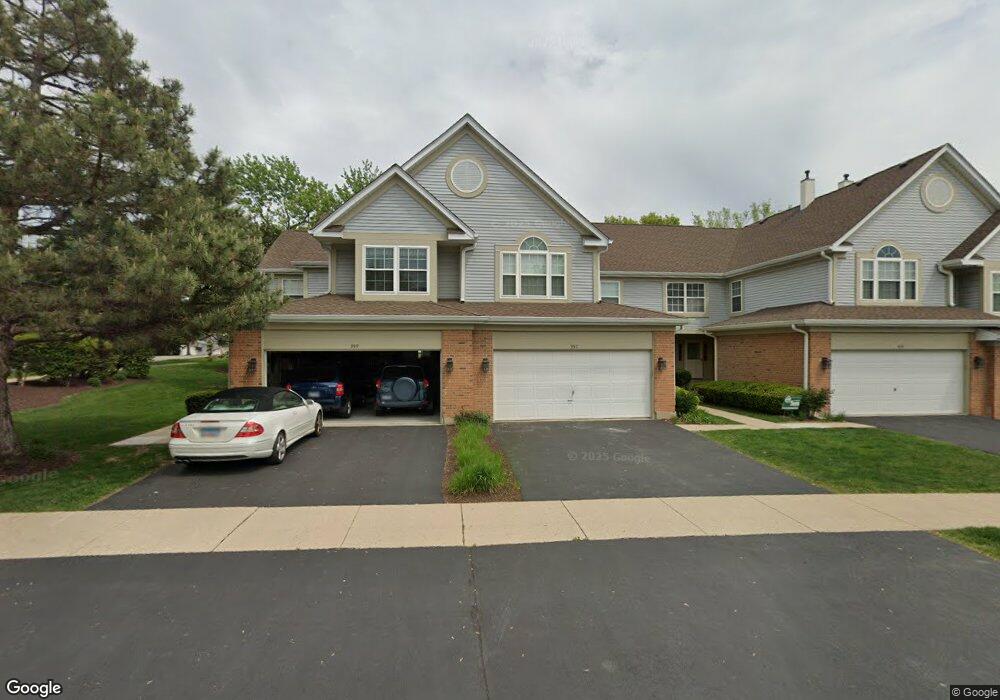
357 Cimarron Rd E Lombard, IL 60148
North Lombard NeighborhoodEstimated Value: $391,000 - $409,000
2
Beds
3
Baths
1,742
Sq Ft
$229/Sq Ft
Est. Value
About This Home
This home is located at 357 Cimarron Rd E, Lombard, IL 60148 and is currently estimated at $398,136, approximately $228 per square foot. 357 Cimarron Rd E is a home located in DuPage County with nearby schools including Forest Glen Elementary School, Hadley Junior High School, and Glenbard West High School.
Ownership History
Date
Name
Owned For
Owner Type
Purchase Details
Closed on
Dec 30, 2025
Sold by
Horrocks Daryl W and Horrocks Sabina Navsariwala
Bought by
Horrocks Family Trust
Current Estimated Value
Purchase Details
Closed on
Feb 22, 2012
Sold by
Sabina Horrocks Daryl W and Sabina Navsariwals
Bought by
Horrocks Daryl W and Horrocks Sabina Navsariwala
Home Financials for this Owner
Home Financials are based on the most recent Mortgage that was taken out on this home.
Original Mortgage
$222,136
Interest Rate
3.75%
Mortgage Type
FHA
Purchase Details
Closed on
Dec 10, 2009
Sold by
Graziano Mary Ann and Ureche Paul D
Bought by
Sabina Horrocks Daryl W and Sabina Navsariwals
Home Financials for this Owner
Home Financials are based on the most recent Mortgage that was taken out on this home.
Original Mortgage
$220,924
Interest Rate
4.84%
Mortgage Type
FHA
Purchase Details
Closed on
May 1, 1995
Sold by
Pinnacle Bank
Bought by
Graziano Mary Ann and Ureche Paul D
Create a Home Valuation Report for This Property
The Home Valuation Report is an in-depth analysis detailing your home's value as well as a comparison with similar homes in the area
Home Values in the Area
Average Home Value in this Area
Purchase History
| Date | Buyer | Sale Price | Title Company |
|---|---|---|---|
| Horrocks Family Trust | -- | None Listed On Document | |
| Horrocks Family Trust | -- | None Listed On Document | |
| Horrocks Daryl W | -- | Transtar National Title | |
| Horrocks Daryl W | -- | Transtar National Title | |
| Sabina Horrocks Daryl W | $225,000 | Able Title Ins Agency Inc | |
| Sabina Horrocks Daryl W | $225,000 | Able Title Ins Agency Inc | |
| Graziano Mary Ann | $182,000 | -- | |
| Graziano Mary Ann | $182,000 | -- |
Source: Public Records
Mortgage History
| Date | Status | Borrower | Loan Amount |
|---|---|---|---|
| Previous Owner | Horrocks Daryl W | $222,136 | |
| Previous Owner | Sabina Horrocks Daryl W | $220,924 |
Source: Public Records
Tax History
| Year | Tax Paid | Tax Assessment Tax Assessment Total Assessment is a certain percentage of the fair market value that is determined by local assessors to be the total taxable value of land and additions on the property. | Land | Improvement |
|---|---|---|---|---|
| 2024 | $7,957 | $108,271 | $23,564 | $84,707 |
| 2023 | $7,652 | $99,660 | $21,690 | $77,970 |
| 2022 | $7,442 | $96,440 | $20,490 | $75,950 |
| 2021 | $7,159 | $94,150 | $20,000 | $74,150 |
| 2020 | $7,041 | $93,270 | $19,810 | $73,460 |
| 2019 | $6,873 | $90,810 | $19,290 | $71,520 |
| 2018 | $5,948 | $77,600 | $18,170 | $59,430 |
| 2017 | $5,860 | $74,740 | $17,500 | $57,240 |
| 2016 | $5,949 | $71,750 | $16,800 | $54,950 |
| 2015 | $5,785 | $68,450 | $16,030 | $52,420 |
| 2014 | $5,951 | $67,980 | $15,920 | $52,060 |
| 2013 | $5,785 | $68,190 | $15,970 | $52,220 |
Source: Public Records
Map
Nearby Homes
- 600 W Pleasant Ln Unit A3
- 440 W Meadow Ave
- 711 N Columbine Ave
- 236 N West Rd
- 114 N Columbine Ave
- 247 N West Rd
- 315 W Sunset Ave
- 102 W Potomac Ave
- 147 W North Ave
- 345 N Park Ave
- 65 S Glenview Ave
- 410 Crescent Blvd Unit 2B
- 324 N Charlotte St
- LOT 2 Armitage Ave
- LOT 9 Armitage Ave
- 7 VACANT LOTS Armitage Ave
- 737 (LOT#21) Lawler Ave
- Lots 15-20 Alma Ave
- 1-11 Alma Ave
- 1 S Lincoln Ave Unit 206
- 355 Cimarron Rd E
- 353 Cimarron Rd E
- 357 Cimarron Rd E
- 359 Cimarron Rd E
- 351 Cimarron Rd E
- 349 Cimarron Rd E
- 349 Cimarron Rd E
- 601 W Pleasant Ln
- 358 Cimarron Rd E
- 356 Cimarron Rd E
- 345 Cimarron Rd E
- 360 Cimarron Rd E
- 354 Cimarron Rd E
- 352 Cimarron Rd E Unit 32
- 343 Cimarron Rd E
- 606 W Pleasant Ln
- 348 Cimarron Rd E
- 1N438 Columbine Ave
- 1N438 Columbine Ave
- 346 Cimarron Rd E