Estimated Value: $446,413 - $480,000
4
Beds
2
Baths
1,617
Sq Ft
$286/Sq Ft
Est. Value
About This Home
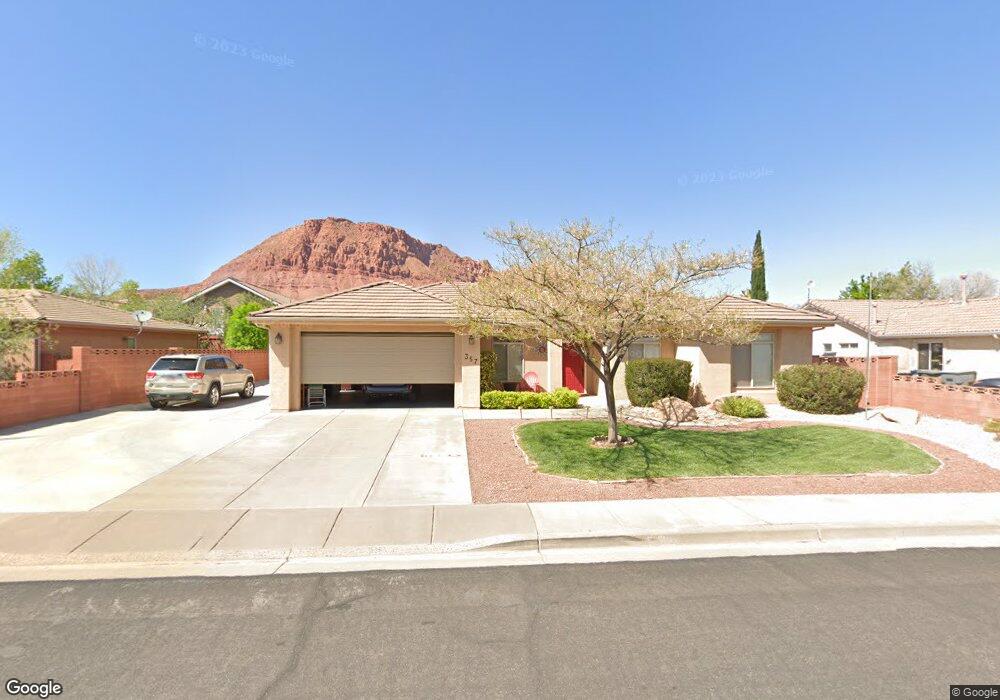
This home is located at 357 E 170 S, Ivins, UT 84738 and is currently estimated at $462,853, approximately $286 per square foot. 357 E 170 S is a home located in Washington County with nearby schools including Red Mountain School, Snow Canyon Middle School, and Lava Ridge Intermediate School.
Ownership History
Date
Name
Owned For
Owner Type
Purchase Details
Closed on
Apr 14, 2017
Sold by
Bushey Barbara R
Bought by
Lillroth Dean and Lillroth Desiree
Current Estimated Value
Purchase Details
Closed on
Mar 14, 2017
Sold by
Bushey Barbara R and Bushey Ii Lionel J
Bought by
Bushey Barbara
Purchase Details
Closed on
Jan 25, 2008
Sold by
Houston Gennesse Ann and Houston Matheson Miles
Bought by
Bushey Ii Lionel J and Bushey Barbara R
Home Financials for this Owner
Home Financials are based on the most recent Mortgage that was taken out on this home.
Original Mortgage
$250,000
Interest Rate
6.07%
Mortgage Type
VA
Purchase Details
Closed on
Jan 18, 2006
Sold by
Wilcox David and Wilcox Sheryl
Bought by
Houston Gennesse Ann and Houston Matheson Miles
Home Financials for this Owner
Home Financials are based on the most recent Mortgage that was taken out on this home.
Original Mortgage
$242,250
Interest Rate
8.12%
Mortgage Type
Adjustable Rate Mortgage/ARM
Create a Home Valuation Report for This Property
The Home Valuation Report is an in-depth analysis detailing your home's value as well as a comparison with similar homes in the area
Purchase History
| Date | Buyer | Sale Price | Title Company |
|---|---|---|---|
| Lillroth Dean | -- | Terra Title | |
| Bushey Barbara | -- | None Available | |
| Bushey Ii Lionel J | -- | Southern Utah Title Co | |
| Houston Gennesse Ann | -- | United Title Services |
Source: Public Records
Mortgage History
| Date | Status | Borrower | Loan Amount |
|---|---|---|---|
| Previous Owner | Bushey Ii Lionel J | $250,000 | |
| Previous Owner | Houston Gennesse Ann | $242,250 |
Source: Public Records
Tax History Compared to Growth
Tax History
| Year | Tax Paid | Tax Assessment Tax Assessment Total Assessment is a certain percentage of the fair market value that is determined by local assessors to be the total taxable value of land and additions on the property. | Land | Improvement |
|---|---|---|---|---|
| 2025 | $1,645 | $245,520 | $68,750 | $176,770 |
| 2023 | $1,621 | $237,545 | $55,000 | $182,545 |
| 2022 | $1,706 | $235,290 | $52,250 | $183,040 |
| 2021 | $1,642 | $336,500 | $65,000 | $271,500 |
| 2020 | $1,530 | $296,800 | $65,000 | $231,800 |
| 2019 | $1,380 | $261,700 | $60,000 | $201,700 |
| 2018 | $1,356 | $132,385 | $0 | $0 |
| 2017 | $1,179 | $111,980 | $0 | $0 |
| 2016 | $1,250 | $109,615 | $0 | $0 |
| 2015 | $26 | $103,015 | $0 | $0 |
| 2014 | -- | $99,660 | $0 | $0 |
Source: Public Records
Map
Nearby Homes
- 339 E 60 S
- 551 E Vasquez Dr
- 443 E Majestic Dr
- 292 S 120 E
- 343 E 500 S
- 555 E Majestic Dr
- 420 S Puerto
- 491 E Padre Lakes Dr
- 691 Crimson Flare Ln
- 473 S Chula Vista Dr
- 515 S 250 E
- 544 S Fiesta Dr
- 565 S 250 E
- 155 E 200 N
- 511 S 660 E
- 375 E 615 S
- 244 E 580 S
- 633 E Flint Rock Cir
- 305 E 650 S
- 492 S Memory Ln