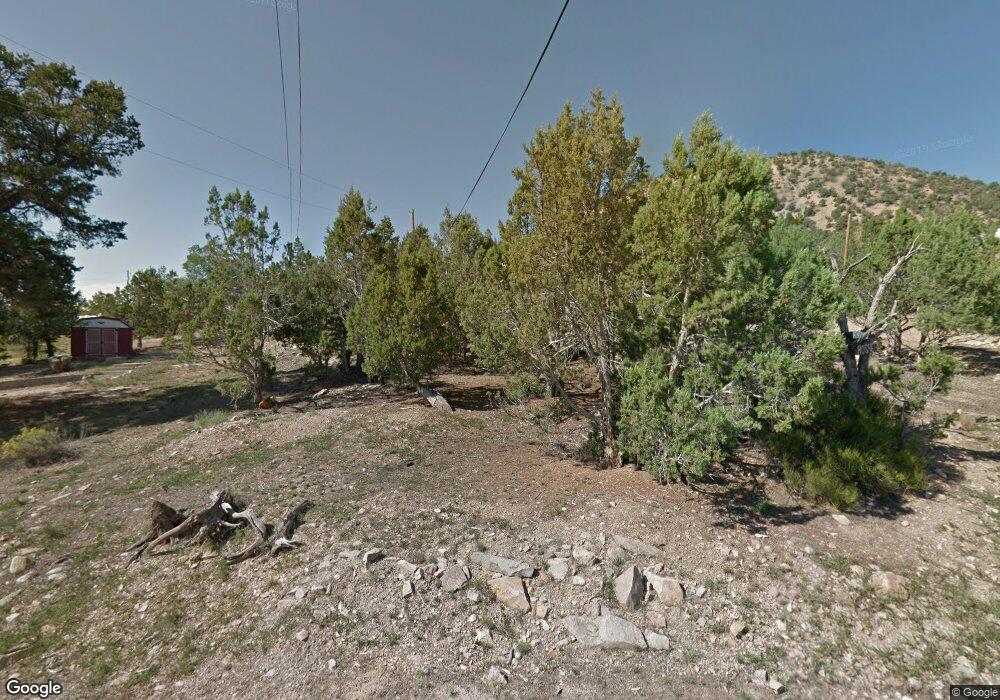
357 Fir St Crawford, CO 81415
Estimated Value: $181,000 - $285,000
1
Bed
1
Bath
1,037
Sq Ft
$232/Sq Ft
Est. Value
About This Home
This home is located at 357 Fir St, Crawford, CO 81415 and is currently estimated at $240,475, approximately $231 per square foot. 357 Fir St is a home with nearby schools including Hotchkiss Elementary School and North Fork High School.
Ownership History
Date
Name
Owned For
Owner Type
Purchase Details
Closed on
Feb 20, 2020
Sold by
Mosher Ellen M
Bought by
Soheue Catherine and Soheue Dave
Current Estimated Value
Home Financials for this Owner
Home Financials are based on the most recent Mortgage that was taken out on this home.
Original Mortgage
$132,700
Outstanding Balance
$90,114
Interest Rate
3%
Mortgage Type
Unknown
Estimated Equity
$150,361
Purchase Details
Closed on
Dec 23, 2019
Sold by
Perry Annette and Mosher Ellen G
Bought by
Mosher Ellen G
Home Financials for this Owner
Home Financials are based on the most recent Mortgage that was taken out on this home.
Original Mortgage
$132,700
Outstanding Balance
$90,114
Interest Rate
3%
Mortgage Type
Unknown
Estimated Equity
$150,361
Purchase Details
Closed on
Sep 27, 2017
Sold by
Mosher Ellen
Bought by
Perry Annette and Mosher Ellen G
Purchase Details
Closed on
Feb 17, 1997
Sold by
Hart
Bought by
Mosher Ellen G and Mosher Mosher
Purchase Details
Closed on
Dec 21, 1995
Sold by
Ruth
Bought by
Mosher Ellen G and Mosher Hart
Create a Home Valuation Report for This Property
The Home Valuation Report is an in-depth analysis detailing your home's value as well as a comparison with similar homes in the area
Purchase History
| Date | Buyer | Sale Price | Title Company |
|---|---|---|---|
| Soheue Catherine | $153,000 | None Available | |
| Mosher Ellen G | -- | None Available | |
| Perry Annette | -- | None Available | |
| Mosher Ellen G | $35,000 | -- | |
| Mosher Ellen G | $35,000 | -- |
Source: Public Records
Mortgage History
| Date | Status | Borrower | Loan Amount |
|---|---|---|---|
| Open | Soheue Catherine | $132,700 |
Source: Public Records
Tax History
| Year | Tax Paid | Tax Assessment Tax Assessment Total Assessment is a certain percentage of the fair market value that is determined by local assessors to be the total taxable value of land and additions on the property. | Land | Improvement |
|---|---|---|---|---|
| 2024 | $603 | $9,151 | $2,508 | $6,643 |
| 2023 | $603 | $9,151 | $2,508 | $6,643 |
| 2022 | $574 | $8,877 | $2,294 | $6,583 |
| 2021 | $577 | $9,132 | $2,360 | $6,772 |
| 2020 | $562 | $8,747 | $2,360 | $6,387 |
| 2019 | $580 | $9,181 | $2,360 | $6,821 |
| 2018 | $449 | $6,807 | $2,376 | $4,431 |
| 2017 | $397 | $6,807 | $2,376 | $4,431 |
| 2016 | $592 | $10,551 | $2,388 | $8,163 |
| 2014 | -- | $8,374 | $2,257 | $6,117 |
Source: Public Records
Map
Nearby Homes
- 361 Fir Ave
- 242 Fir Ave
- 240 F St
- 221 F St
- 0 Greenwood Ave Unit REC5488227
- 0 Tbd Greenwood Ave
- 81924 & 82100 Highway 92
- 410 Highway 92
- 100 Highway 92
- 428 Highway 92
- 287 Highway 92
- 62 C St
- 000 Highway 92
- 93 Highway 92
- 40331 D Rd
- 40801 D Rd
- 40300 D Rd
- 78300 Hunters Ridge Ln
- 38626 Indian Head Ln
- 2605 Antler Ct
Your Personal Tour Guide
Ask me questions while you tour the home.