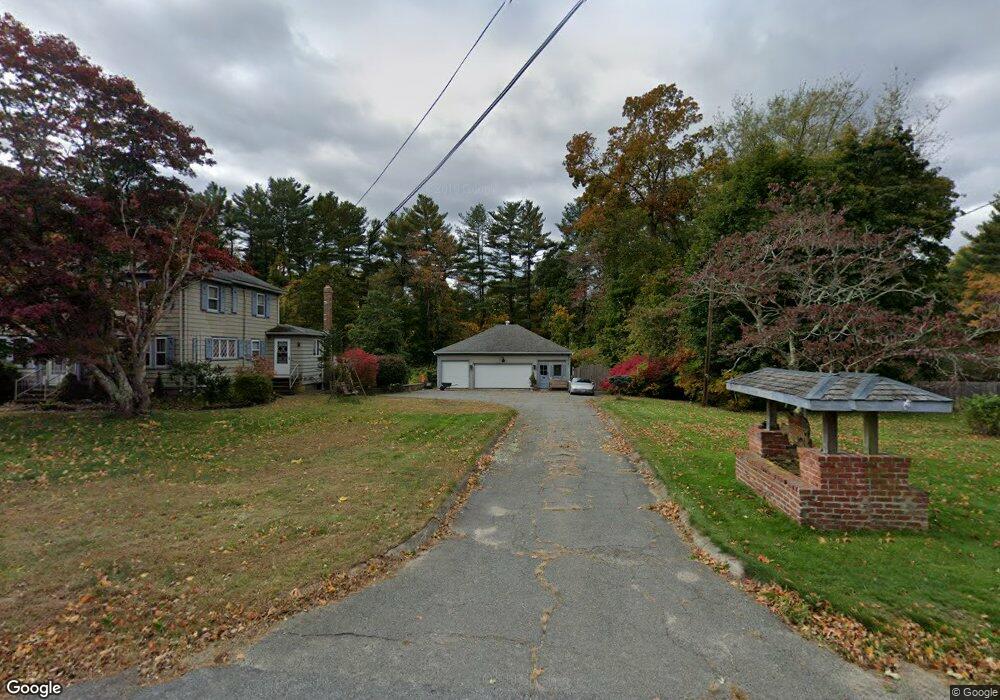
357 High St Hanson, MA 02341
Estimated Value: $509,000 - $620,000
2
Beds
2
Baths
1,892
Sq Ft
$303/Sq Ft
Est. Value
About This Home
This home is located at 357 High St, Hanson, MA 02341 and is currently estimated at $573,379, approximately $303 per square foot. 357 High St is a home located in Plymouth County.
Ownership History
Date
Name
Owned For
Owner Type
Purchase Details
Closed on
May 19, 2022
Sold by
Re Daniel E
Bought by
Daniel Emile Realty Irt
Current Estimated Value
Purchase Details
Closed on
Oct 19, 2004
Sold by
Re Daniel E and Re Cheryl A
Bought by
Re Daniel E
Home Financials for this Owner
Home Financials are based on the most recent Mortgage that was taken out on this home.
Original Mortgage
$200,000
Interest Rate
5.8%
Mortgage Type
Purchase Money Mortgage
Create a Home Valuation Report for This Property
The Home Valuation Report is an in-depth analysis detailing your home's value as well as a comparison with similar homes in the area
Home Values in the Area
Average Home Value in this Area
Purchase History
| Date | Buyer | Sale Price | Title Company |
|---|---|---|---|
| Daniel Emile Realty Irt | -- | None Available | |
| Re Daniel E | -- | -- |
Source: Public Records
Mortgage History
| Date | Status | Borrower | Loan Amount |
|---|---|---|---|
| Previous Owner | Re Daniel E | $196,000 | |
| Previous Owner | Re Daniel E | $200,000 | |
| Previous Owner | Re Daniel E | $101,000 |
Source: Public Records
Tax History
| Year | Tax Paid | Tax Assessment Tax Assessment Total Assessment is a certain percentage of the fair market value that is determined by local assessors to be the total taxable value of land and additions on the property. | Land | Improvement |
|---|---|---|---|---|
| 2025 | $5,474 | $409,100 | $182,500 | $226,600 |
| 2024 | $5,377 | $401,900 | $177,200 | $224,700 |
| 2023 | $5,413 | $381,700 | $177,200 | $204,500 |
| 2022 | $5,294 | $350,800 | $161,100 | $189,700 |
| 2021 | $4,903 | $324,700 | $154,900 | $169,800 |
| 2020 | $4,694 | $307,400 | $149,600 | $157,800 |
| 2019 | $13 | $296,100 | $146,700 | $149,400 |
| 2018 | $0 | $288,300 | $141,100 | $147,200 |
| 2017 | $4,450 | $278,500 | $134,400 | $144,100 |
| 2016 | $4,543 | $274,500 | $134,400 | $140,100 |
| 2015 | $4,343 | $272,800 | $134,400 | $138,400 |
Source: Public Records
Map
Nearby Homes
- 80 Phillips St
- 72 Phillips St
- Lot 6 Way
- Lot 2 Harvard Rd
- 1054 Main St
- 361A County Rd
- 361 County Rd
- 61 Sawmill Ln
- 61 Sawmill Ln Unit 61
- 161 Winter St Unit 11
- 84 Liberty St
- 26 Franklin St
- Lot 5 Princeton Way
- 126-130 Franklin St
- 1754 Central St
- 134 Crescent St
- 127 Crescent Place
- 170 Elm St
- 269 Lakeside Rd
- 318 South St
Your Personal Tour Guide
Ask me questions while you tour the home.