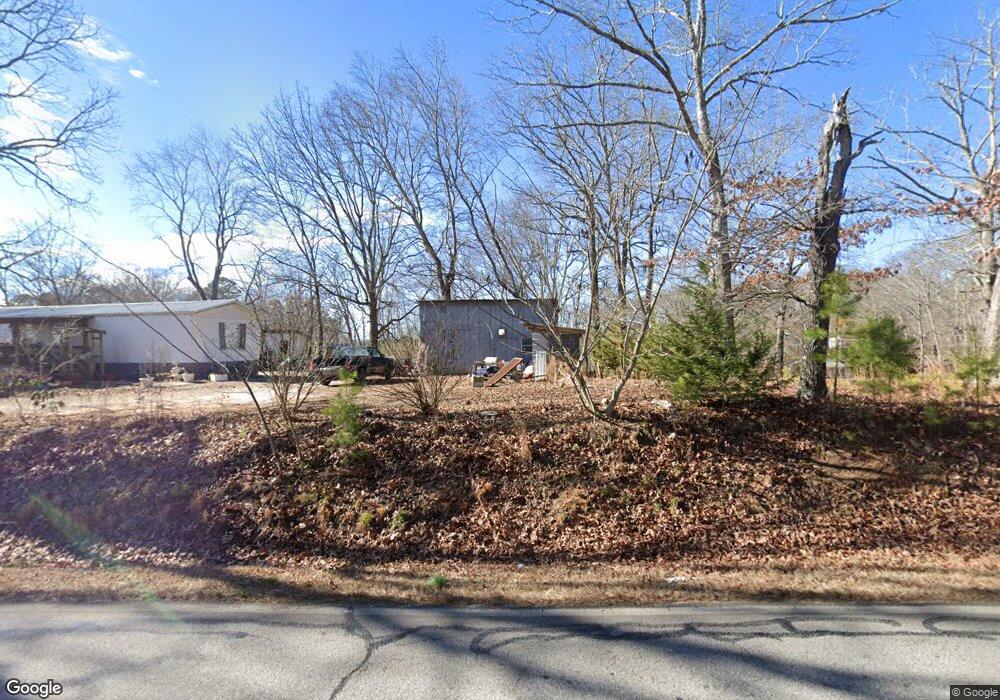
357 Historic Old Highway 441 Unit A Clarkesville, GA 30523
Estimated Value: $433,000
3
Beds
2
Baths
1,588
Sq Ft
$273/Sq Ft
Est. Value
About This Home
This home is located at 357 Historic Old Highway 441 Unit A, Clarkesville, GA 30523 and is currently estimated at $433,000, approximately $272 per square foot. 357 Historic Old Highway 441 Unit A is a home located in Habersham County with nearby schools including Woodville Elementary School, North Habersham Middle School, and Habersham Success Academy.
Ownership History
Date
Name
Owned For
Owner Type
Purchase Details
Closed on
Dec 10, 2024
Sold by
Alley Mark
Bought by
Curbow Wesley Blake
Current Estimated Value
Home Financials for this Owner
Home Financials are based on the most recent Mortgage that was taken out on this home.
Original Mortgage
$337,600
Outstanding Balance
$330,880
Interest Rate
6.78%
Mortgage Type
Mortgage Modification
Estimated Equity
$102,120
Purchase Details
Closed on
Apr 12, 2024
Sold by
Alley & Taylor Enterprises Llc
Bought by
Alley Mark and Taylor Wesley
Purchase Details
Closed on
Jan 31, 2023
Sold by
Alley Mark
Bought by
Alley & Taylor Enterprises Llc
Purchase Details
Closed on
Mar 3, 2017
Bought by
Alley Mark and Alley Taylor Wesley
Purchase Details
Closed on
Aug 23, 2012
Sold by
Heaton J Mark
Bought by
Blue Hills Llc
Purchase Details
Closed on
Aug 3, 2010
Sold by
Heaton Lois M
Bought by
Heaton J Mark
Create a Home Valuation Report for This Property
The Home Valuation Report is an in-depth analysis detailing your home's value as well as a comparison with similar homes in the area
Home Values in the Area
Average Home Value in this Area
Purchase History
| Date | Buyer | Sale Price | Title Company |
|---|---|---|---|
| Curbow Wesley Blake | $400,000 | -- | |
| Alley Mark | -- | -- | |
| Alley & Taylor Enterprises Llc | -- | -- | |
| Alley Mark | $145,000 | -- | |
| Blue Hills Llc | -- | -- | |
| Denny Leland R | -- | -- | |
| Heaton J Mark | -- | -- |
Source: Public Records
Mortgage History
| Date | Status | Borrower | Loan Amount |
|---|---|---|---|
| Open | Curbow Wesley Blake | $337,600 |
Source: Public Records
Tax History Compared to Growth
Tax History
| Year | Tax Paid | Tax Assessment Tax Assessment Total Assessment is a certain percentage of the fair market value that is determined by local assessors to be the total taxable value of land and additions on the property. | Land | Improvement |
|---|---|---|---|---|
| 2025 | $276 | $117,134 | $117,134 | $0 |
| 2024 | -- | $65,344 | $65,344 | $0 |
| 2023 | $1,665 | $121,436 | $67,360 | $54,076 |
| 2022 | $1,656 | $118,676 | $72,352 | $46,324 |
| 2021 | $1,505 | $109,736 | $68,212 | $41,524 |
| 2020 | $1,398 | $104,016 | $68,212 | $35,804 |
| 2019 | $1,392 | $104,016 | $68,212 | $35,804 |
| 2018 | $1,382 | $104,016 | $68,212 | $35,804 |
| 2017 | $2,541 | $94,620 | $61,712 | $32,908 |
| 2016 | $2,467 | $236,550 | $61,712 | $32,908 |
| 2015 | $2,438 | $236,550 | $61,712 | $32,908 |
| 2014 | $2,468 | $234,990 | $61,712 | $32,284 |
| 2013 | -- | $93,996 | $61,712 | $32,284 |
Source: Public Records
Map
Nearby Homes
- 2085 Buckhorn Rd
- 1386 441 Old Hist Hwy
- 620 Blackberry Ln
- 805 Beaver Lake Dr
- 712 Meadow Run Ct
- 124 Rockford Farm Dr
- LOT 2 Hollywood Church Rd
- LOT 3 Hollywood Church Rd
- LOT 4 Hollywood Church Rd
- 766 Hollywood Church Rd
- LOT 1 Hollywood Church Rd
- 315 Glade Rock Springs Rd
- 200 Mountain Meadow Rd
- 200 Mountain Meadows Rd
- 0 Buckhorn Rd Unit 10556339
- 366 Mossy Creek Ln
- 602 Gibson Rd
- 281 Grindstone Creek Dr
- 253 Grindstone Creek Dr
- 931 Turkey Crest
- 331 Historic Old Highway 441
- 391 Historic Old Highway 441
- 455 Historic Old Hwy 441 Unit 2-3
- 455 Historic Old Unit 200
- 534 Old Historic Highway 441
- 0 John Wood Rd Unit 10082760
- 0 John Wood Rd Unit 20028935
- 0 John Wood Rd Unit 7629495
- 0 John Wood Rd Unit 8671606
- 441 Historic Old Highway 441
- 494 Sanders St
- 265 Historic Old Highway 441
- 291 441 Old Hist Hwy
- 291 Historic Old Highway 441
- 0 Old Historic Hwy 441 Unit TR A&B 7402618
- 0 Old Historic Hwy 441 Unit 7529345
- 0 Old Historic Hwy 441 Unit 7373149
- 479 Historic Old Highway 441
- 467 Sanders St
- 438 Sanders St Unit 7