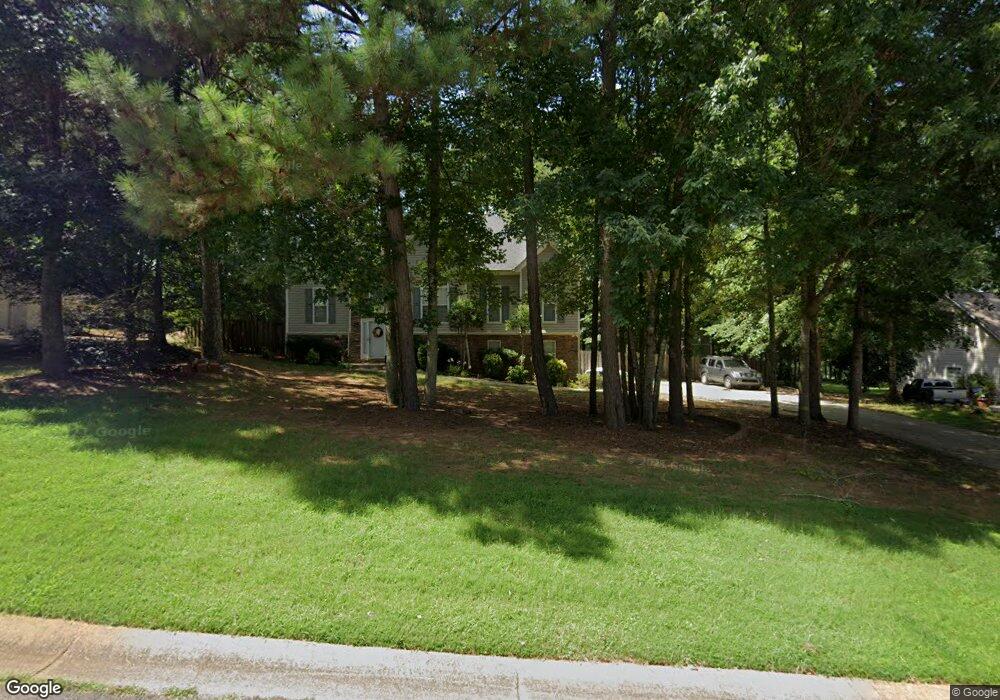
357 Line Creek Cir Sharpsburg, GA 30277
Estimated Value: $406,000 - $428,000
3
Beds
3
Baths
2,264
Sq Ft
$184/Sq Ft
Est. Value
About This Home
This home is located at 357 Line Creek Cir, Sharpsburg, GA 30277 and is currently estimated at $417,054, approximately $184 per square foot. 357 Line Creek Cir is a home located in Coweta County with nearby schools including Canongate Elementary School, Madras Middle School, and Northgate High School.
Ownership History
Date
Name
Owned For
Owner Type
Purchase Details
Closed on
Dec 4, 2003
Sold by
Crossroads Inv Llc
Bought by
Harmsen Jason and Harmsen Natalia
Current Estimated Value
Home Financials for this Owner
Home Financials are based on the most recent Mortgage that was taken out on this home.
Original Mortgage
$168,300
Outstanding Balance
$78,404
Interest Rate
6.07%
Mortgage Type
New Conventional
Estimated Equity
$338,650
Purchase Details
Closed on
Sep 2, 2003
Sold by
Taylor Ulvey
Bought by
Crossroads Inv Llc
Purchase Details
Closed on
Dec 16, 1998
Sold by
Taylor Ulvey
Bought by
Bradd Scott A and Bradd Carol A
Home Financials for this Owner
Home Financials are based on the most recent Mortgage that was taken out on this home.
Original Mortgage
$144,738
Interest Rate
6.9%
Mortgage Type
VA
Purchase Details
Closed on
Jun 24, 1998
Sold by
C & W Development In
Bought by
Smith and Whitener Con
Purchase Details
Closed on
Nov 13, 1997
Sold by
Carpenter Thomas and Carpenter D
Bought by
C & W Development In
Create a Home Valuation Report for This Property
The Home Valuation Report is an in-depth analysis detailing your home's value as well as a comparison with similar homes in the area
Home Values in the Area
Average Home Value in this Area
Purchase History
| Date | Buyer | Sale Price | Title Company |
|---|---|---|---|
| Harmsen Jason | $182,000 | -- | |
| Crossroads Inv Llc | $139,100 | -- | |
| Crossroads Investments Llc | -- | -- | |
| Bradd Scott A | -- | -- | |
| Taylor Ulvey | $141,900 | -- | |
| Smith | $130,500 | -- | |
| C & W Development In | $492,000 | -- |
Source: Public Records
Mortgage History
| Date | Status | Borrower | Loan Amount |
|---|---|---|---|
| Open | Harmsen Jason | $168,300 | |
| Previous Owner | Taylor Ulvey | $144,738 |
Source: Public Records
Tax History Compared to Growth
Tax History
| Year | Tax Paid | Tax Assessment Tax Assessment Total Assessment is a certain percentage of the fair market value that is determined by local assessors to be the total taxable value of land and additions on the property. | Land | Improvement |
|---|---|---|---|---|
| 2025 | $3,919 | $177,162 | $30,000 | $147,162 |
| 2024 | $3,503 | $153,410 | $26,000 | $127,410 |
| 2023 | $3,503 | $166,494 | $26,000 | $140,494 |
| 2022 | $2,882 | $119,765 | $26,000 | $93,765 |
| 2021 | $2,453 | $96,046 | $18,000 | $78,046 |
| 2020 | $2,468 | $96,046 | $18,000 | $78,046 |
| 2019 | $2,216 | $78,864 | $16,000 | $62,864 |
| 2018 | $2,220 | $78,864 | $16,000 | $62,864 |
| 2017 | $1,950 | $69,677 | $12,000 | $57,677 |
| 2016 | $1,929 | $69,677 | $12,000 | $57,677 |
| 2015 | $2,004 | $73,308 | $12,000 | $61,308 |
| 2014 | $1,727 | $67,084 | $12,000 | $55,084 |
Source: Public Records
Map
Nearby Homes
- 11 Line Creek Cir
- 100 Ashland Trail
- 121 Northwoods Rd
- 104 Ashland Trail
- 150 Kylemore Pass
- 110 Kylemore Pass
- 95 Tyler Woods Dr
- 25 Sycamore Way
- 12 Race Point Way
- 135 Crimson Ridge
- 20 Skipton Ct
- 259 Strathmore Dr Unit 3
- 100 Clydesdale Ct
- 319 Beaconsfield Dr
- 2185 Castle Lake Dr
- 40 Wenham Ln
- 70 N Strathmore Dr
- 125 Cannongate Cir
- 200 Chaparral Trace
- 131 Cannongate Cir
- 369 Line Creek Cir
- 349 Line Creek Cir
- 381 Line Creek Cir
- 131 Line Creek Way
- 358 Line Creek Cir
- 339 Line Creek Cir
- 393 Line Creek Cir
- 259 Stowe Way
- 247 Stowe Way
- 233 Stowe Way
- 329 Line Creek Cir
- 319 Line Creek Cir
- 124 Line Creek Way
- 290 Line Creek Cir
- 263 Stowe Way
- 405 Line Creek Cir Unit 24
- 405 Line Creek Cir
- 215 Stowe Way
- 311 Line Creek Cir
- 274 Line Creek Cir