Estimated Value: $433,000 - $458,000
--
Bed
--
Bath
1,260
Sq Ft
$354/Sq Ft
Est. Value
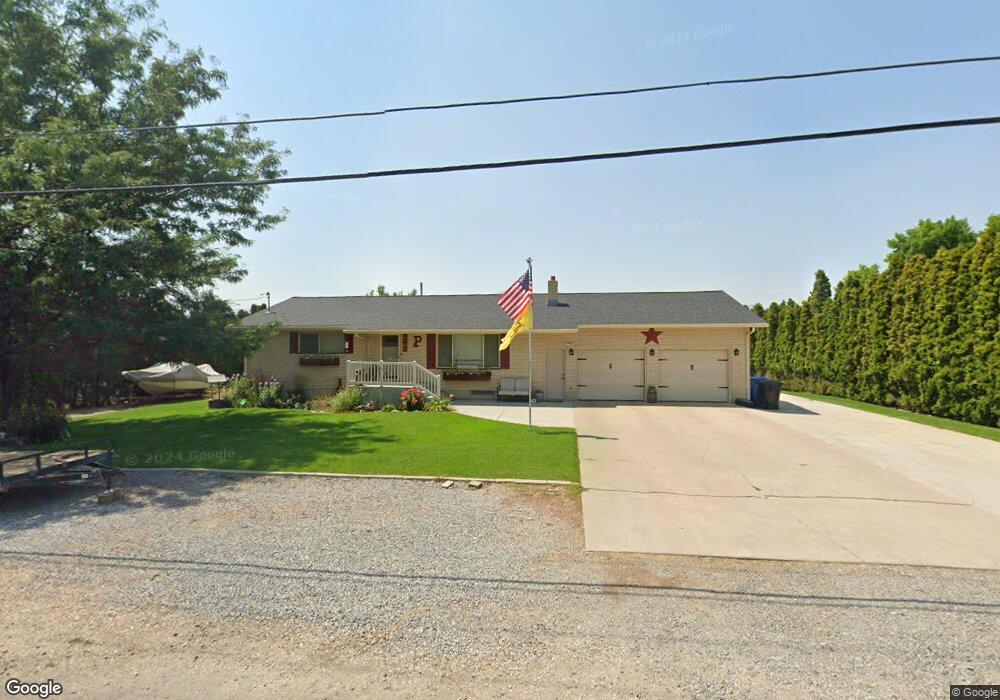
About This Home
This home is located at 357 N 400 W, Hyrum, UT 84319 and is currently estimated at $446,167, approximately $354 per square foot. 357 N 400 W is a home with nearby schools including Lincoln School, South Cache Middle School, and Mountain Crest High School.
Ownership History
Date
Name
Owned For
Owner Type
Purchase Details
Closed on
Apr 23, 2021
Sold by
Pearce Morgan and Pearce Heidi
Bought by
Pearce Heidi and Pearce Morgan
Current Estimated Value
Home Financials for this Owner
Home Financials are based on the most recent Mortgage that was taken out on this home.
Original Mortgage
$207,000
Outstanding Balance
$186,490
Interest Rate
3%
Mortgage Type
New Conventional
Estimated Equity
$259,677
Purchase Details
Closed on
Oct 27, 2016
Sold by
Brown William C and Brown Darlene
Bought by
Pearce Morgan and Pearce Heidi
Home Financials for this Owner
Home Financials are based on the most recent Mortgage that was taken out on this home.
Original Mortgage
$220,924
Interest Rate
3.42%
Mortgage Type
FHA
Purchase Details
Closed on
Apr 12, 2001
Sold by
Brown William C and Brown Darlene
Bought by
Brown William C and Brown Darlene
Create a Home Valuation Report for This Property
The Home Valuation Report is an in-depth analysis detailing your home's value as well as a comparison with similar homes in the area
Home Values in the Area
Average Home Value in this Area
Purchase History
| Date | Buyer | Sale Price | Title Company |
|---|---|---|---|
| Pearce Heidi | -- | Cache Title Logan | |
| Pearce Morgan | -- | American Secure Title | |
| Brown William C | -- | -- |
Source: Public Records
Mortgage History
| Date | Status | Borrower | Loan Amount |
|---|---|---|---|
| Open | Pearce Heidi | $207,000 | |
| Closed | Pearce Morgan | $220,924 |
Source: Public Records
Tax History Compared to Growth
Tax History
| Year | Tax Paid | Tax Assessment Tax Assessment Total Assessment is a certain percentage of the fair market value that is determined by local assessors to be the total taxable value of land and additions on the property. | Land | Improvement |
|---|---|---|---|---|
| 2025 | $1,540 | $221,065 | $0 | $0 |
| 2024 | $1,641 | $219,985 | $0 | $0 |
| 2023 | $1,573 | $201,675 | $0 | $0 |
| 2022 | $1,642 | $201,680 | $0 | $0 |
| 2021 | $1,524 | $288,470 | $65,000 | $223,470 |
| 2020 | $1,334 | $236,900 | $65,000 | $171,900 |
| 2019 | $1,418 | $236,900 | $65,000 | $171,900 |
| 2018 | $1,062 | $171,488 | $40,000 | $131,488 |
| 2017 | $1,033 | $86,570 | $0 | $0 |
| 2016 | $1,056 | $86,570 | $0 | $0 |
| 2015 | $1,059 | $86,570 | $0 | $0 |
| 2014 | $1,035 | $86,570 | $0 | $0 |
| 2013 | -- | $82,710 | $0 | $0 |
Source: Public Records
Map
Nearby Homes