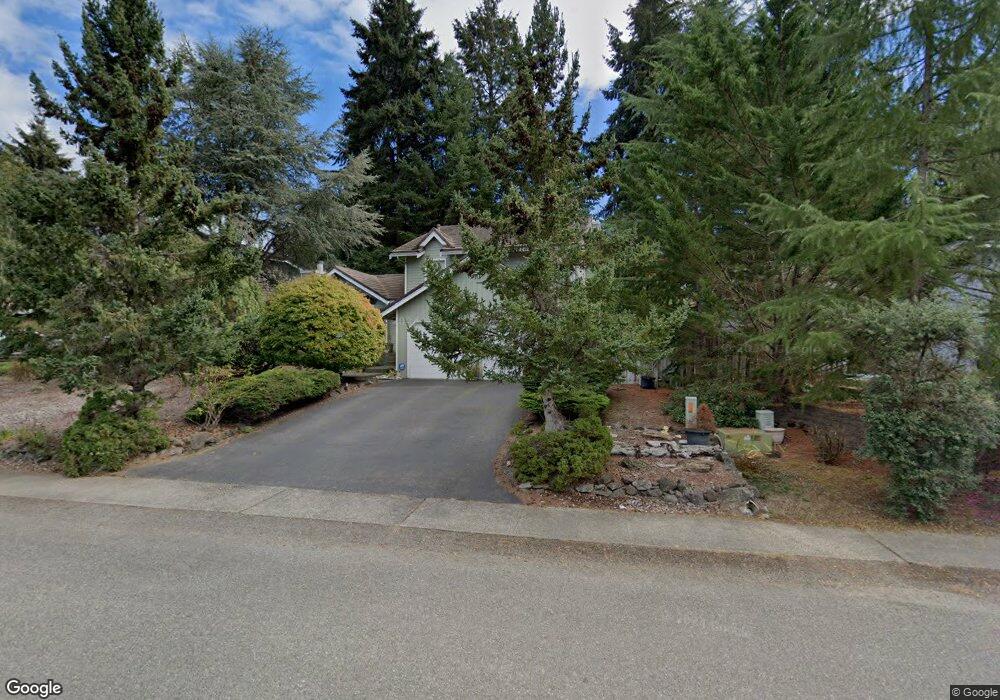
357 NW San Juan Dr Bremerton, WA 98311
Estimated Value: $528,000 - $548,000
3
Beds
3
Baths
1,512
Sq Ft
$358/Sq Ft
Est. Value
About This Home
This home is located at 357 NW San Juan Dr, Bremerton, WA 98311 and is currently estimated at $541,146, approximately $357 per square foot. 357 NW San Juan Dr is a home located in Kitsap County with nearby schools including Woodlands Elementary School, Fairview Middle School, and Olympic High School.
Ownership History
Date
Name
Owned For
Owner Type
Purchase Details
Closed on
Nov 8, 2004
Sold by
Beloate Eddie T and Beloate Kara C
Bought by
Tracewell David C and Tracewell Shannon L
Current Estimated Value
Home Financials for this Owner
Home Financials are based on the most recent Mortgage that was taken out on this home.
Original Mortgage
$175,200
Outstanding Balance
$86,964
Interest Rate
5.7%
Mortgage Type
New Conventional
Estimated Equity
$454,182
Purchase Details
Closed on
Aug 21, 1998
Sold by
Needens Kevin J and Needens Amy L
Bought by
Beloate Eddie T and Beloate Kara C
Home Financials for this Owner
Home Financials are based on the most recent Mortgage that was taken out on this home.
Original Mortgage
$134,800
Interest Rate
6.91%
Purchase Details
Closed on
Apr 19, 1995
Sold by
Dick Michael D and Dick Chi S
Bought by
Needens Kevin J and Needens Amy L
Home Financials for this Owner
Home Financials are based on the most recent Mortgage that was taken out on this home.
Original Mortgage
$97,200
Interest Rate
8.44%
Create a Home Valuation Report for This Property
The Home Valuation Report is an in-depth analysis detailing your home's value as well as a comparison with similar homes in the area
Home Values in the Area
Average Home Value in this Area
Purchase History
| Date | Buyer | Sale Price | Title Company |
|---|---|---|---|
| Tracewell David C | $219,000 | Pacific Nw Title | |
| Beloate Eddie T | $139,000 | Land Title Company | |
| Needens Kevin J | $129,500 | Stewart Title Company |
Source: Public Records
Mortgage History
| Date | Status | Borrower | Loan Amount |
|---|---|---|---|
| Open | Tracewell David C | $175,200 | |
| Previous Owner | Beloate Eddie T | $134,800 | |
| Previous Owner | Needens Kevin J | $97,200 |
Source: Public Records
Tax History Compared to Growth
Tax History
| Year | Tax Paid | Tax Assessment Tax Assessment Total Assessment is a certain percentage of the fair market value that is determined by local assessors to be the total taxable value of land and additions on the property. | Land | Improvement |
|---|---|---|---|---|
| 2026 | $4,604 | $495,030 | $100,190 | $394,840 |
| 2025 | $4,604 | $495,030 | $100,190 | $394,840 |
| 2024 | $4,474 | $494,730 | $100,190 | $394,540 |
| 2023 | $4,489 | $494,730 | $100,190 | $394,540 |
| 2022 | $4,225 | $410,180 | $82,800 | $327,380 |
| 2021 | $3,809 | $351,320 | $61,250 | $290,070 |
| 2020 | $3,555 | $331,920 | $57,790 | $274,130 |
| 2019 | $3,311 | $299,230 | $52,190 | $247,040 |
| 2018 | $3,552 | $248,730 | $43,130 | $205,600 |
| 2017 | $3,151 | $248,730 | $43,130 | $205,600 |
| 2016 | $3,060 | $223,390 | $38,510 | $184,880 |
| 2015 | $2,844 | $216,640 | $42,650 | $173,990 |
| 2014 | -- | $192,750 | $42,650 | $150,100 |
| 2013 | -- | $192,750 | $42,650 | $150,100 |
Source: Public Records
Map
Nearby Homes
- 476 Bridle View Place NW
- 250 NE Silver Pine Dr
- 7237 Harvard Ct NW
- 679 NE Conifer Dr
- 241 NE Watson Ct
- 960 NE Marwood Dr
- 7545 Old Military Rd NE
- 6748 Scorpio Ln NE
- 404 NE Saturn Ln
- 7529 Bridge Place NE
- 425 NE Saturn Ln
- 7701 Beacon Place NE Unit B103
- 156 NE Zodiac Ln
- 1210 NW Huckle Dr
- 910 NW Leisure Ln
- 7761 Beacon Place NE Unit G-107
- 7761 Beacon Place NE Unit 103
- 563 NW Silver Glen Ln
- 6441 Holland Rd NW
- 6630 NE Aquarius Ln
- 361 NW San Juan Dr
- 353 NW San Juan Dr
- 7613 Orcas Place NW
- 349 NW San Juan Dr
- 365 NW San Juan Dr
- 358 NW San Juan Dr
- 362 NW San Juan Dr
- 7611 Orcas Place NW
- 356 NW San Juan Dr
- 7615 Orcas Place NW
- 354 NW San Juan Dr
- 378 NW San Juan Dr
- 369 NW San Juan Dr
- 345 NW San Juan Dr
- 7610 Orcas Place NW
- 373 NW San Juan Dr
- 7658 Sucia Place NW
- 7619 Orcas Place NW
- 341 NW San Juan Dr
- 7652 Sucia Place NW