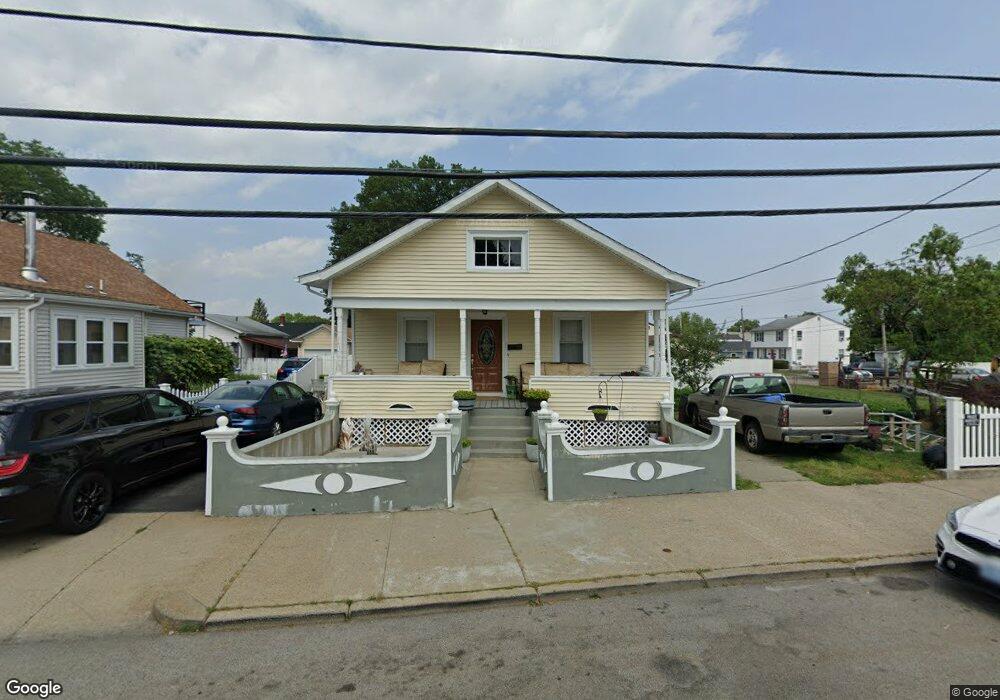
357 Power Rd Pawtucket, RI 02860
Fairlawn NeighborhoodEstimated Value: $358,000 - $394,452
2
Beds
1
Bath
988
Sq Ft
$378/Sq Ft
Est. Value
About This Home
This home is located at 357 Power Rd, Pawtucket, RI 02860 and is currently estimated at $373,613, approximately $378 per square foot. 357 Power Rd is a home located in Providence County with nearby schools including Blackstone Valley Prep Upper Elementary School, Bishop Keough Regional High School, and Ocean Tides School.
Ownership History
Date
Name
Owned For
Owner Type
Purchase Details
Closed on
Mar 14, 2005
Sold by
Allen Mark E and Allen Pamela F
Bought by
Santos Aquila C and Santos John M
Current Estimated Value
Home Financials for this Owner
Home Financials are based on the most recent Mortgage that was taken out on this home.
Original Mortgage
$138,400
Outstanding Balance
$69,367
Interest Rate
5.64%
Mortgage Type
Purchase Money Mortgage
Estimated Equity
$304,246
Purchase Details
Closed on
Nov 6, 2001
Sold by
Blackmon Majorie E
Bought by
Allen Mark E and Allen Pamela F
Home Financials for this Owner
Home Financials are based on the most recent Mortgage that was taken out on this home.
Original Mortgage
$102,050
Interest Rate
6.82%
Create a Home Valuation Report for This Property
The Home Valuation Report is an in-depth analysis detailing your home's value as well as a comparison with similar homes in the area
Home Values in the Area
Average Home Value in this Area
Purchase History
| Date | Buyer | Sale Price | Title Company |
|---|---|---|---|
| Santos Aquila C | $173,000 | -- | |
| Allen Mark E | $128,000 | -- |
Source: Public Records
Mortgage History
| Date | Status | Borrower | Loan Amount |
|---|---|---|---|
| Open | Allen Mark E | $138,400 | |
| Closed | Allen Mark E | $34,600 | |
| Previous Owner | Allen Mark E | $102,050 |
Source: Public Records
Tax History
| Year | Tax Paid | Tax Assessment Tax Assessment Total Assessment is a certain percentage of the fair market value that is determined by local assessors to be the total taxable value of land and additions on the property. | Land | Improvement |
|---|---|---|---|---|
| 2025 | $3,912 | $297,500 | $137,000 | $160,500 |
| 2024 | $3,671 | $297,500 | $137,000 | $160,500 |
| 2023 | $3,571 | $210,800 | $82,600 | $128,200 |
| 2022 | $3,495 | $210,800 | $82,600 | $128,200 |
| 2021 | $2,820 | $170,100 | $82,600 | $87,500 |
| 2020 | $2,442 | $116,900 | $58,000 | $58,900 |
| 2019 | $2,442 | $116,900 | $58,000 | $58,900 |
| 2018 | $2,353 | $116,900 | $58,000 | $58,900 |
| 2017 | $2,504 | $110,200 | $64,100 | $46,100 |
| 2016 | $2,412 | $110,200 | $64,100 | $46,100 |
| 2015 | $2,412 | $110,200 | $64,100 | $46,100 |
| 2014 | $2,401 | $104,100 | $64,100 | $40,000 |
Source: Public Records
Map
Nearby Homes
- 60 Stedman Ave
- 957 Mineral Spring Ave
- 60 Dorman Ave
- 53 Oriole Ave
- 458 Smithfield Ave
- 2 Ward Ave
- 82 Hillcrest Ave
- 53 Francis Ave
- 63 Chandler Ave
- 18 Fairmont Ave
- 220 Francis Ave
- 11 Franklin St
- 121 Samuel Ave
- 1190 Charles St Unit 14
- 5 Morrill Ln Unit C
- 1002 Charles St
- 2 Cobble Hill Rd
- 53 Samuel Ave
- 16 Rufus St
- 0 Piave St
- 363 Power Rd
- 139 Prentice Ave
- 365 Power Rd
- 76 Atwood Ave
- 70 Atwood Ave
- 127 Prentice Ave
- 354 Power Rd
- 64 Atwood Ave
- 358 Power Rd
- 364 Power Rd
- 350 Power Rd
- 126 Prentice Ave Unit Floor
- 126 Prentice Ave Unit 1
- 375 Power Rd
- 79 Atwood Ave
- 121 Prentice Ave
- 60 Atwood Ave
- 124 Prentice Ave
- 81 Atwood Ave
- 71 Atwood Ave
Your Personal Tour Guide
Ask me questions while you tour the home.