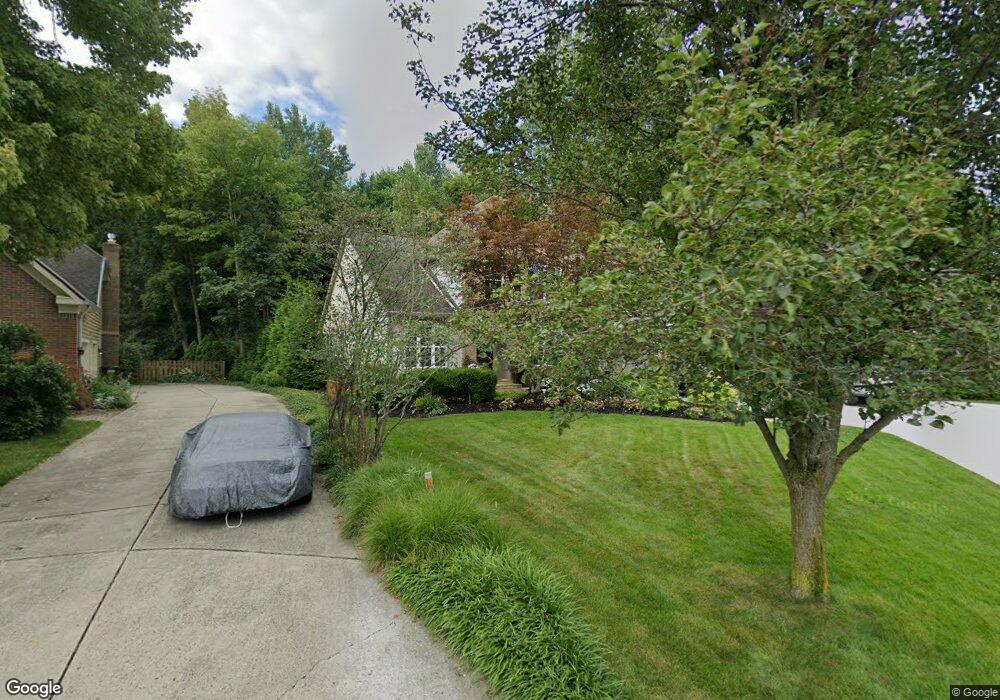
357 Rosewood Ct Powell, OH 43065
Estimated Value: $616,000 - $665,000
4
Beds
3
Baths
2,847
Sq Ft
$225/Sq Ft
Est. Value
About This Home
This home is located at 357 Rosewood Ct, Powell, OH 43065 and is currently estimated at $640,097, approximately $224 per square foot. 357 Rosewood Ct is a home located in Delaware County with nearby schools including Tyler Run Elementary School, Olentangy Liberty Middle School, and Olentangy Liberty High School.
Ownership History
Date
Name
Owned For
Owner Type
Purchase Details
Closed on
Nov 5, 2008
Sold by
Williams Brian C and Williams Christi M
Bought by
Deacon Leslie A
Current Estimated Value
Home Financials for this Owner
Home Financials are based on the most recent Mortgage that was taken out on this home.
Original Mortgage
$300,000
Outstanding Balance
$197,025
Interest Rate
6.09%
Mortgage Type
Purchase Money Mortgage
Estimated Equity
$443,072
Purchase Details
Closed on
Oct 15, 1999
Sold by
Truberry Group Inc
Bought by
Williams Brian C and Williams Christi M
Home Financials for this Owner
Home Financials are based on the most recent Mortgage that was taken out on this home.
Original Mortgage
$260,000
Interest Rate
7.9%
Mortgage Type
New Conventional
Purchase Details
Closed on
Dec 4, 1997
Sold by
President'S Club Investm
Bought by
R Corp/Ss Ltd
Create a Home Valuation Report for This Property
The Home Valuation Report is an in-depth analysis detailing your home's value as well as a comparison with similar homes in the area
Home Values in the Area
Average Home Value in this Area
Purchase History
| Date | Buyer | Sale Price | Title Company |
|---|---|---|---|
| Deacon Leslie A | $335,000 | Title First | |
| Williams Brian C | $308,169 | -- | |
| R Corp/Ss Ltd | $128,000 | -- |
Source: Public Records
Mortgage History
| Date | Status | Borrower | Loan Amount |
|---|---|---|---|
| Open | Deacon Leslie A | $300,000 | |
| Previous Owner | Williams Brian C | $260,000 |
Source: Public Records
Tax History
| Year | Tax Paid | Tax Assessment Tax Assessment Total Assessment is a certain percentage of the fair market value that is determined by local assessors to be the total taxable value of land and additions on the property. | Land | Improvement |
|---|---|---|---|---|
| 2024 | $11,138 | $210,180 | $37,660 | $172,520 |
| 2023 | $11,056 | $210,180 | $37,660 | $172,520 |
| 2022 | $8,543 | $128,770 | $25,730 | $103,040 |
| 2021 | $8,690 | $128,770 | $25,730 | $103,040 |
| 2020 | $8,721 | $128,770 | $25,730 | $103,040 |
| 2019 | $8,089 | $123,870 | $25,730 | $98,140 |
| 2018 | $8,182 | $123,870 | $25,730 | $98,140 |
| 2017 | $7,739 | $112,250 | $24,960 | $87,290 |
| 2016 | $7,956 | $112,250 | $24,960 | $87,290 |
| 2015 | $7,239 | $112,250 | $24,960 | $87,290 |
| 2014 | $7,336 | $112,250 | $24,960 | $87,290 |
| 2013 | $7,229 | $108,090 | $24,960 | $83,130 |
Source: Public Records
Map
Nearby Homes
- 424 Whitaker Ave S
- 471 Commons Dr Unit 471
- 97 Murphys Crossing Dr
- 1937 Liberty St
- 18 Murphys View Place Unit I18
- 11 Murphys View Place
- 120 S Liberty St
- 10010 Beckford Ct
- 104 Encore Park Bend
- 9978 Lavenham Cir W
- 4933 Emerald Lakes Blvd Unit 4903
- 2672 Sawmill Reserve Dr Unit 2672
- 9427 Clermont Cir Unit 9427
- 3899 Hampshire Ave
- 130 Barrington Place
- 149 Chedworth Row
- 170 Barrington Place
- 3910 Summit View Rd
- 9529 Wayne Brown Dr
- 4445 Tavistock Cir
- 369 Rosewood Ct
- 353 Rosewood Ct
- 379 Rosewood Ct
- 345 Rosewood Ct
- 402 Vinwood Ln
- 388 Vinwood Ln
- 412 Vinwood Ln
- 376 Vinwood Ln
- 344 Rosewood Ct
- 362 Vinwood Ln
- 356 Rosewood Ct
- 389 Rosewood Ct
- 364 Rosewood Ct
- 374 Rosewood Ct
- 346 Rosewood Ct
- 348 Vinwood Ln
- 384 Rosewood Ct
- 403 Rosewood Ct
- 306 Vinwood Ln
- 326 Vinwood Ln
Your Personal Tour Guide
Ask me questions while you tour the home.