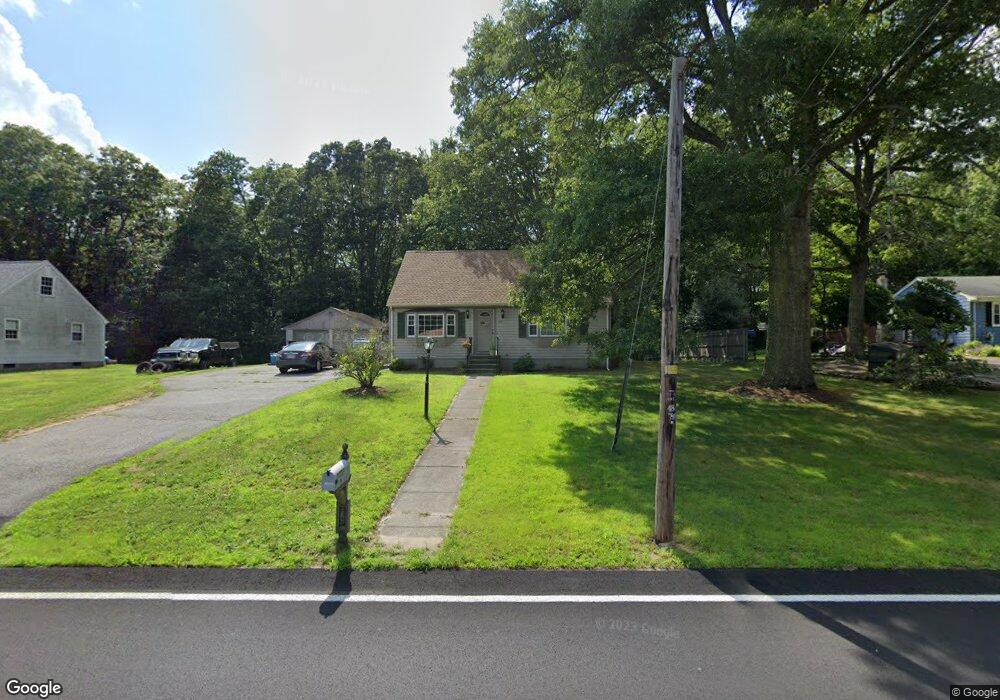
357 Tickle Rd Westport, MA 02790
North Westport NeighborhoodEstimated Value: $469,000 - $619,000
3
Beds
--
Bath
1,701
Sq Ft
$316/Sq Ft
Est. Value
About This Home
This home is located at 357 Tickle Rd, Westport, MA 02790 and is currently estimated at $536,692, approximately $315 per square foot. 357 Tickle Rd is a home located in Bristol County with nearby schools including Alice A. Macomber Primary School, Westport Elementary School, and Westport Middle-High School.
Ownership History
Date
Name
Owned For
Owner Type
Purchase Details
Closed on
Jan 26, 2016
Sold by
Es Roynestad Beverly A
Bought by
Roynestad Heidi L
Current Estimated Value
Home Financials for this Owner
Home Financials are based on the most recent Mortgage that was taken out on this home.
Original Mortgage
$183,000
Outstanding Balance
$146,026
Interest Rate
3.98%
Mortgage Type
New Conventional
Estimated Equity
$390,666
Purchase Details
Closed on
Dec 18, 1967
Bought by
Roynestad Beverly A
Create a Home Valuation Report for This Property
The Home Valuation Report is an in-depth analysis detailing your home's value as well as a comparison with similar homes in the area
Home Values in the Area
Average Home Value in this Area
Purchase History
| Date | Buyer | Sale Price | Title Company |
|---|---|---|---|
| Roynestad Heidi L | $234,000 | -- | |
| Roynestad Beverly A | -- | -- |
Source: Public Records
Mortgage History
| Date | Status | Borrower | Loan Amount |
|---|---|---|---|
| Open | Roynestad Heidi L | $183,000 | |
| Previous Owner | Roynestad Beverly A | $27,048 | |
| Previous Owner | Roynestad Beverly A | $35,000 | |
| Previous Owner | Roynestad Beverly A | $35,000 |
Source: Public Records
Tax History Compared to Growth
Tax History
| Year | Tax Paid | Tax Assessment Tax Assessment Total Assessment is a certain percentage of the fair market value that is determined by local assessors to be the total taxable value of land and additions on the property. | Land | Improvement |
|---|---|---|---|---|
| 2025 | $3,300 | $443,000 | $175,900 | $267,100 |
| 2024 | $3,015 | $390,100 | $162,900 | $227,200 |
| 2023 | $2,925 | $358,500 | $142,800 | $215,700 |
| 2022 | $2,714 | $327,900 | $142,800 | $185,100 |
| 2021 | $2,714 | $314,900 | $129,800 | $185,100 |
| 2020 | $2,611 | $309,700 | $124,600 | $185,100 |
| 2019 | $2,366 | $286,100 | $108,400 | $177,700 |
| 2018 | $2,085 | $255,200 | $116,600 | $138,600 |
| 2017 | $2,047 | $256,900 | $116,600 | $140,300 |
| 2016 | $1,997 | $252,500 | $116,600 | $135,900 |
| 2015 | $1,936 | $244,100 | $116,600 | $127,500 |
Source: Public Records
Map
Nearby Homes
- 33 Moniz Dr
- 40 Robert St
- 51 Newton St
- 219 Tickle Rd
- 218 American Legion Hwy
- 0 Tickle Rd Unit 73453134
- 8 Campion Ave
- 47 Robert St
- 47 Devol Ave
- 14 Glendale Ave
- 100 Cory's Ln
- 1125 Stafford Rd Unit 5
- 0 Crandall Rd
- 100 Corys Ln
- 75 Montgomery St
- 308 Robert St
- 6 Angel Ct
- 374 Crandall Rd
- 771 Sanford Rd
- 447 Stafford Rd Unit E7