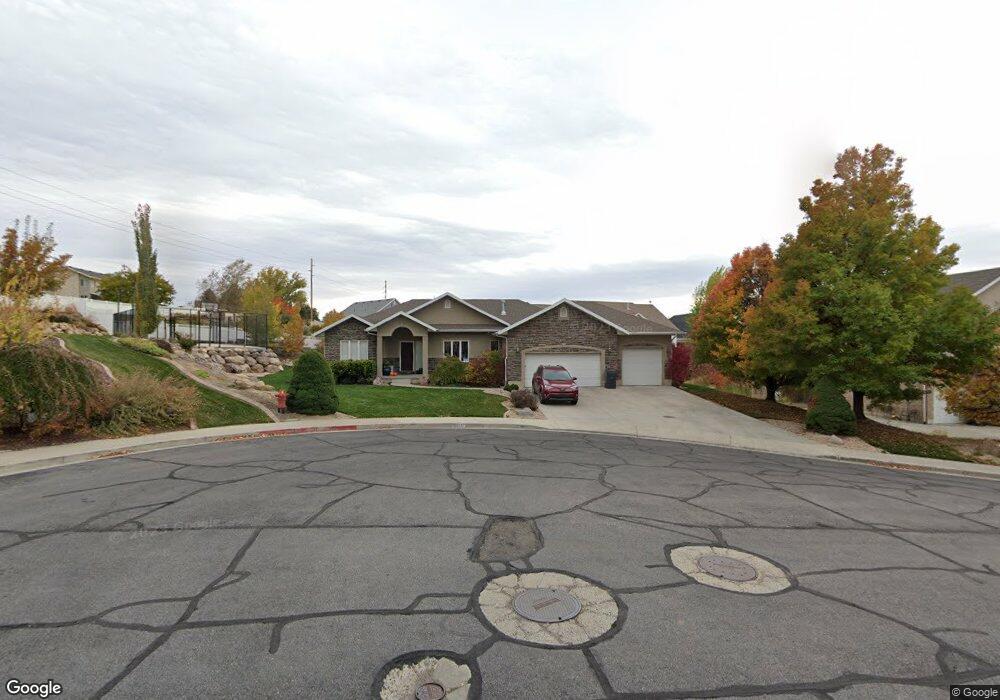
357 W 120 S Lindon, UT 84042
Estimated Value: $854,000 - $997,000
5
Beds
4
Baths
3,979
Sq Ft
$233/Sq Ft
Est. Value
About This Home
This home is located at 357 W 120 S, Lindon, UT 84042 and is currently estimated at $926,669, approximately $232 per square foot. 357 W 120 S is a home located in Utah County with nearby schools including Aspen Elementary School, Oak Canyon Junior High School, and Pleasant Grove High School.
Ownership History
Date
Name
Owned For
Owner Type
Purchase Details
Closed on
Jul 17, 2019
Sold by
Winegar Clark D
Bought by
Winegar Clark D and Winegar Linda S
Current Estimated Value
Home Financials for this Owner
Home Financials are based on the most recent Mortgage that was taken out on this home.
Original Mortgage
$444,800
Outstanding Balance
$389,684
Interest Rate
3.82%
Mortgage Type
New Conventional
Estimated Equity
$536,985
Purchase Details
Closed on
May 14, 2003
Sold by
Saddle Ridge Estates Lc
Bought by
Williams Gary A and Williams Jacqueline A
Home Financials for this Owner
Home Financials are based on the most recent Mortgage that was taken out on this home.
Original Mortgage
$239,400
Interest Rate
5.71%
Mortgage Type
Construction
Create a Home Valuation Report for This Property
The Home Valuation Report is an in-depth analysis detailing your home's value as well as a comparison with similar homes in the area
Home Values in the Area
Average Home Value in this Area
Purchase History
| Date | Buyer | Sale Price | Title Company |
|---|---|---|---|
| Winegar Clark D | -- | Accommodation | |
| Winegar Clark D | -- | Highland Title | |
| Williams Gary A | -- | Provo Land Title Company |
Source: Public Records
Mortgage History
| Date | Status | Borrower | Loan Amount |
|---|---|---|---|
| Open | Winegar Clark D | $444,800 | |
| Previous Owner | Williams Gary A | $239,400 |
Source: Public Records
Tax History Compared to Growth
Tax History
| Year | Tax Paid | Tax Assessment Tax Assessment Total Assessment is a certain percentage of the fair market value that is determined by local assessors to be the total taxable value of land and additions on the property. | Land | Improvement |
|---|---|---|---|---|
| 2025 | $3,788 | $508,860 | $428,900 | $496,300 |
| 2024 | $3,788 | $467,005 | $0 | $0 |
| 2023 | $3,517 | $465,685 | $0 | $0 |
| 2022 | $3,508 | $448,690 | $0 | $0 |
| 2021 | $2,944 | $567,900 | $256,200 | $311,700 |
| 2020 | $2,703 | $513,200 | $213,500 | $299,700 |
| 2019 | $2,543 | $503,800 | $213,500 | $290,300 |
| 2018 | $2,538 | $473,900 | $183,600 | $290,300 |
| 2017 | $2,409 | $241,230 | $0 | $0 |
| 2016 | $2,487 | $230,340 | $0 | $0 |
| 2015 | $2,503 | $219,120 | $0 | $0 |
| 2014 | $2,375 | $206,030 | $0 | $0 |
Source: Public Records
Map
Nearby Homes