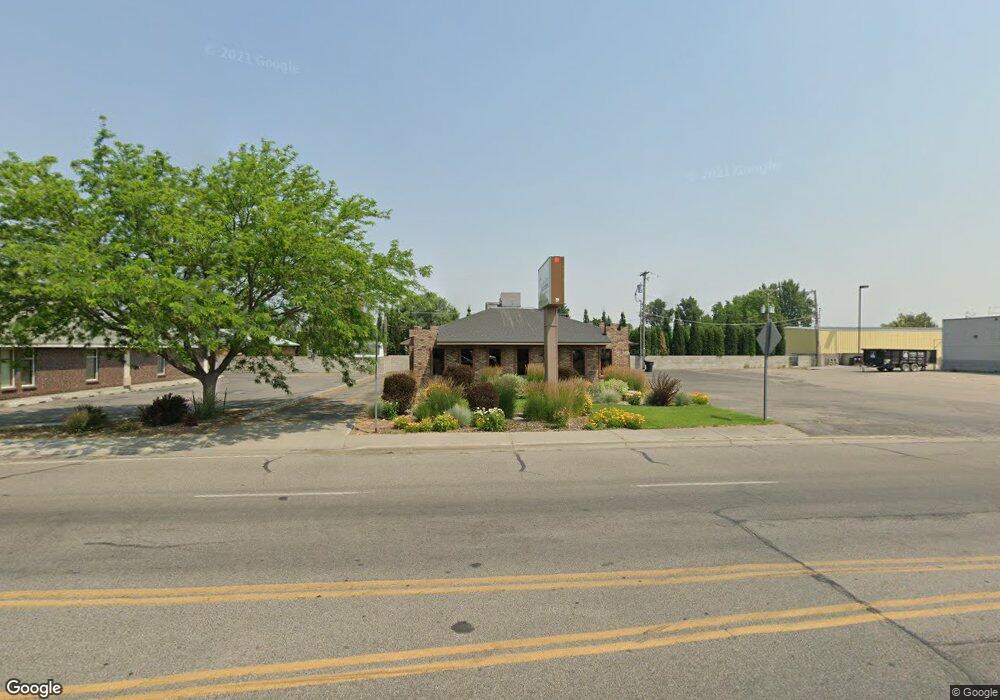
357 W Fir St Shelley, ID 83274
Estimated Value: $235,389
--
Bed
2
Baths
3,644
Sq Ft
$65/Sq Ft
Est. Value
About This Home
This home is located at 357 W Fir St, Shelley, ID 83274 and is currently estimated at $235,389, approximately $64 per square foot. 357 W Fir St is a home located in Bingham County with nearby schools including Riverview Elementary School, Sunrise Elementary School, and Hazel Stuart Elementary School.
Ownership History
Date
Name
Owned For
Owner Type
Purchase Details
Closed on
Oct 29, 2020
Sold by
Dennis Radford O D Pa
Bought by
Snake River Eye Assc Of Shelley Llc
Current Estimated Value
Home Financials for this Owner
Home Financials are based on the most recent Mortgage that was taken out on this home.
Original Mortgage
$100,000
Outstanding Balance
$88,986
Interest Rate
2.8%
Mortgage Type
Commercial
Estimated Equity
$146,403
Purchase Details
Closed on
Apr 19, 2012
Sold by
Redford Dennis and Redford Shaundel
Bought by
Dennis Radford O D Pa
Purchase Details
Closed on
Apr 11, 2012
Sold by
Zions First National Bank
Bought by
Radford Dennis and Radford Shaundel
Purchase Details
Closed on
Dec 14, 2006
Sold by
Christenssen Thomas
Bought by
Long Robert J and Long Elizabeth Susan
Home Financials for this Owner
Home Financials are based on the most recent Mortgage that was taken out on this home.
Original Mortgage
$185,000
Interest Rate
6.32%
Mortgage Type
Commercial
Create a Home Valuation Report for This Property
The Home Valuation Report is an in-depth analysis detailing your home's value as well as a comparison with similar homes in the area
Home Values in the Area
Average Home Value in this Area
Purchase History
| Date | Buyer | Sale Price | Title Company |
|---|---|---|---|
| Snake River Eye Assc Of Shelley Llc | -- | Accommodation | |
| Dennis Radford O D Pa | -- | None Available | |
| Radford Dennis | -- | None Available | |
| Long Robert J | -- | -- |
Source: Public Records
Mortgage History
| Date | Status | Borrower | Loan Amount |
|---|---|---|---|
| Open | Snake River Eye Assc Of Shelley Llc | $100,000 | |
| Previous Owner | Long Robert J | $185,000 | |
| Closed | Radford Dennis | $0 |
Source: Public Records
Tax History Compared to Growth
Tax History
| Year | Tax Paid | Tax Assessment Tax Assessment Total Assessment is a certain percentage of the fair market value that is determined by local assessors to be the total taxable value of land and additions on the property. | Land | Improvement |
|---|---|---|---|---|
| 2025 | $2,074 | $372,250 | $44,250 | $328,000 |
| 2024 | $2,074 | $210,720 | $22,110 | $188,610 |
| 2023 | $2,210 | $210,720 | $22,110 | $188,610 |
| 2022 | $3,593 | $210,720 | $22,110 | $188,610 |
| 2021 | $3,366 | $210,720 | $22,110 | $188,610 |
| 2020 | $3,473 | $240,120 | $0 | $0 |
| 2019 | $4,145 | $240,120 | $0 | $0 |
| 2018 | $2,506 | $136,730 | $18,430 | $118,300 |
| 2017 | $2,590 | $136,730 | $18,430 | $118,300 |
| 2016 | $2,506 | $136,730 | $0 | $0 |
| 2015 | $2,477 | $136,730 | $0 | $0 |
| 2014 | $2,503 | $136,730 | $18,430 | $118,300 |
Source: Public Records
Map
Nearby Homes
- 631 Holley St
- 434 S Park Ave
- 393 W Pine St
- 570 S Park Ave
- L1 B6 E Meadow Mist Ave
- L7 B6 E Meadow Walk Dr
- L6 B6 E Meadow Walk Dr
- L11 B4 E Meadow Mist Ave
- L5 B6 E Meadow Walk Dr
- Kensington Plan at Sunset Vista
- Canyon Plan at Sunset Vista
- Brantwood Plan at Sunset Vista
- Xavier Plan at Sunset Vista
- Edgeworth Plan at Sunset Vista
- Clearpoint Plan at Sunset Vista
- Ashland Plan at Sunset Vista
- Denford Plan at Sunset Vista
- Northfield Plan at Sunset Vista
- Ravenstone Plan at Sunset Vista
- 285 W Center St