357 Wax Rd SE Silver Creek, GA 30173
Estimated Value: $255,000 - $285,000
--
Bed
--
Bath
1,338
Sq Ft
$205/Sq Ft
Est. Value
About This Home
This home is located at 357 Wax Rd SE, Silver Creek, GA 30173 and is currently estimated at $273,654, approximately $204 per square foot. 357 Wax Rd SE is a home located in Floyd County with nearby schools including Pepperell Middle School and Pepperell High School.
Ownership History
Date
Name
Owned For
Owner Type
Purchase Details
Closed on
Jun 11, 2018
Sold by
Mccoy Amy Davis
Bought by
Newman Brandie and Greene Paul
Current Estimated Value
Home Financials for this Owner
Home Financials are based on the most recent Mortgage that was taken out on this home.
Original Mortgage
$148,950
Outstanding Balance
$128,817
Interest Rate
4.5%
Mortgage Type
New Conventional
Estimated Equity
$144,837
Purchase Details
Closed on
Oct 27, 2000
Bought by
P and R
Purchase Details
Closed on
Feb 2, 2000
Sold by
Mccoy Irah Marion
Bought by
Mccoy Irah Marion and Mccoy Amy D
Purchase Details
Closed on
Apr 2, 1990
Sold by
Mccoy F H
Bought by
Mccoy Irah Marion
Purchase Details
Closed on
Jul 11, 1984
Bought by
P and R
Purchase Details
Closed on
Mar 28, 1984
Bought by
P and R
Purchase Details
Closed on
Sep 16, 1982
Bought by
P and R
Purchase Details
Closed on
Jan 1, 1954
Bought by
Mccoy F H
Create a Home Valuation Report for This Property
The Home Valuation Report is an in-depth analysis detailing your home's value as well as a comparison with similar homes in the area
Home Values in the Area
Average Home Value in this Area
Purchase History
| Date | Buyer | Sale Price | Title Company |
|---|---|---|---|
| Newman Brandie | $165,500 | -- | |
| P | -- | -- | |
| Mccoy Irah Marion | -- | -- | |
| Mccoy Irah Marion | -- | -- | |
| P | -- | -- | |
| P | -- | -- | |
| P | -- | -- | |
| Mccoy F H | -- | -- |
Source: Public Records
Mortgage History
| Date | Status | Borrower | Loan Amount |
|---|---|---|---|
| Open | Newman Brandie | $148,950 |
Source: Public Records
Tax History Compared to Growth
Tax History
| Year | Tax Paid | Tax Assessment Tax Assessment Total Assessment is a certain percentage of the fair market value that is determined by local assessors to be the total taxable value of land and additions on the property. | Land | Improvement |
|---|---|---|---|---|
| 2024 | $2,111 | $89,929 | $29,645 | $60,284 |
| 2023 | $2,069 | $85,789 | $26,950 | $58,839 |
| 2022 | $1,576 | $59,961 | $22,295 | $37,666 |
| 2021 | $1,440 | $52,491 | $20,174 | $32,317 |
| 2020 | $1,367 | $48,624 | $17,542 | $31,082 |
| 2019 | $1,327 | $47,348 | $17,542 | $29,806 |
| 2018 | $1,384 | $46,004 | $16,708 | $29,296 |
| 2017 | $1,341 | $43,872 | $15,470 | $28,402 |
| 2016 | $0 | $40,281 | $15,440 | $24,841 |
| 2015 | $0 | $40,281 | $15,440 | $24,841 |
| 2014 | -- | $40,281 | $15,440 | $24,841 |
Source: Public Records
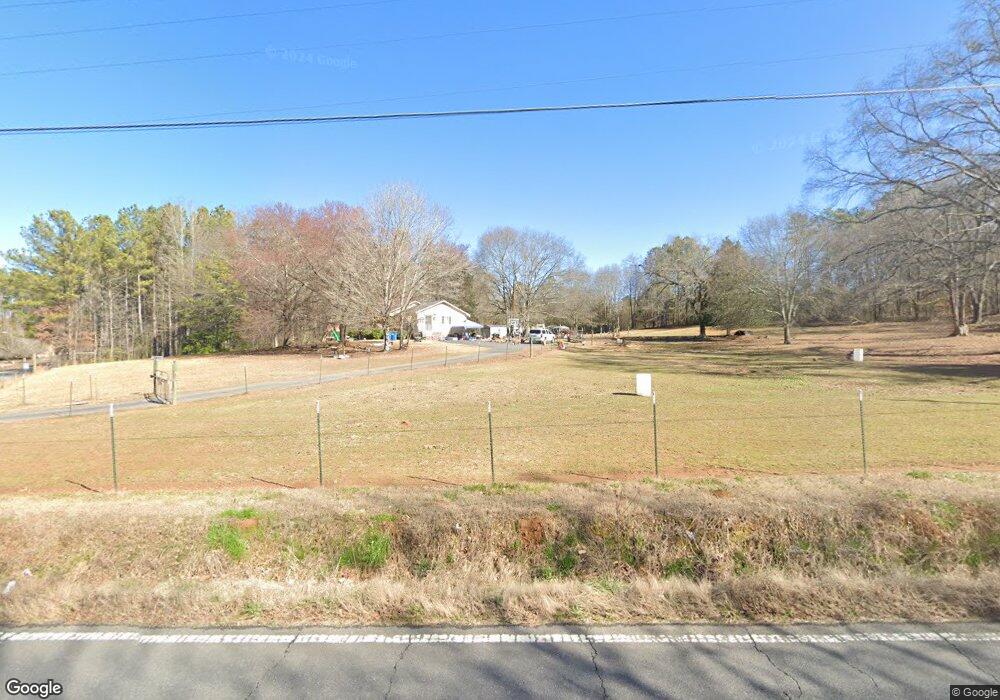
Map
Nearby Homes
- 421 Wax Rd SE
- 4622 Rockmart Rd SE
- 290 Donahoo Rd SE
- 682 Wax Rd SE
- 9 Woodberry Dr SE
- 29 Crossridge Dr SE
- 965 Old Rockmart Rd SE
- 2 Silvermont Dr SE
- 74 Preacher Smith Rd
- 1531 Old Rockmart Rd SE
- 865 Old Rockmart Rd SE
- 550 Donahoo Rd SE
- 62 Ramblewood Dr SE
- 23 Rainwood Cir SE
- 894 Wax Rd SE
- 7 Timberwood Dr SE
- 13 Rainwood Dr SE
- 16 Timberwood Dr SE
- 37 Ramblewood Dr SE
- 2 Midway Park Rd SE
- 0 Wax Rd SE Unit 5883619
- 0 Wax Rd SE Unit 8230158
- 0 Wax Rd SE Unit 3177982
- 0 Wax Rd SE Unit 3207318
- 0 Wax Rd SE Unit 7079875
- 0 Wax Rd SE Unit 7164263
- 0 Wax Rd SE Unit 7183901
- 0 Wax Rd SE Unit 7183853
- 0 Wax Rd SE Unit 340 7327121
- 0 Wax Rd SE
- 0 Wax Rd SE Unit 7476086
- 0 Wax Rd SE Unit 7456560
- 0 Wax Rd SE Unit 10324506
- 0 Wax Rd SE Unit 7407761
- 0 Wax Rd SE Unit 7196864
- 0 Wax Rd SE Unit 20113271
- 0 Wax Rd SE Unit 7557097
- 0 Wax Rd SE Unit 8034667
- 0 Wax Rd SE Unit 9005456