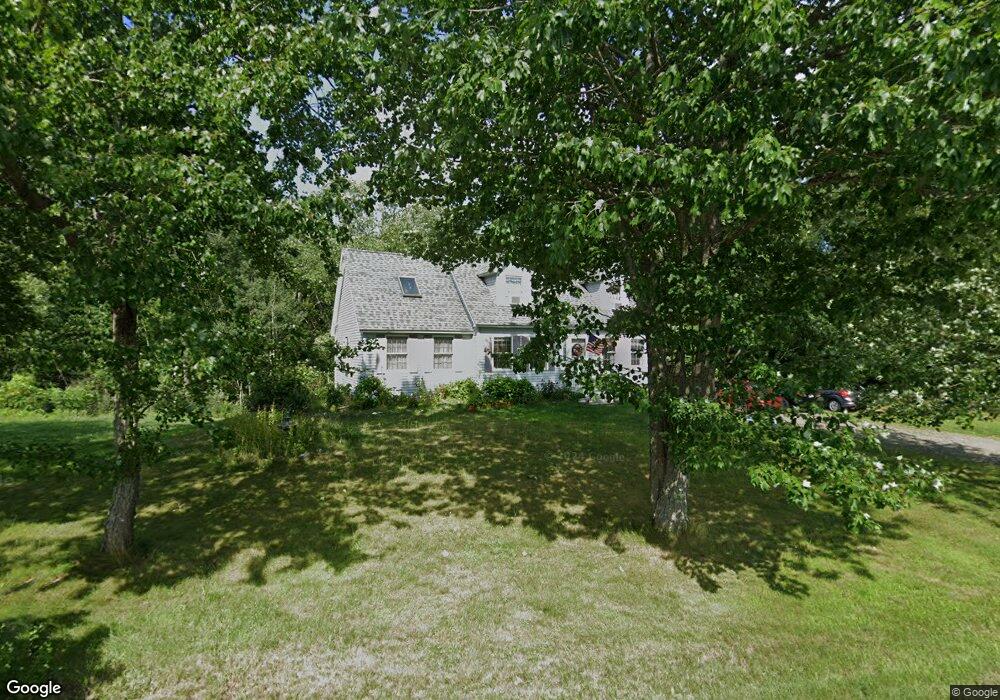
357 West St Biddeford, ME 04005
South Biddeford NeighborhoodEstimated Value: $463,000 - $506,095
3
Beds
3
Baths
1,647
Sq Ft
$288/Sq Ft
Est. Value
About This Home
This home is located at 357 West St, Biddeford, ME 04005 and is currently estimated at $474,524, approximately $288 per square foot. 357 West St is a home located in York County with nearby schools including John F Kennedy Memorial School, Biddeford Primary School, and Biddeford Intermediate School.
Ownership History
Date
Name
Owned For
Owner Type
Purchase Details
Closed on
Aug 20, 2019
Sold by
Langan Madeline L
Bought by
Madeline L Langan Ret
Current Estimated Value
Create a Home Valuation Report for This Property
The Home Valuation Report is an in-depth analysis detailing your home's value as well as a comparison with similar homes in the area
Home Values in the Area
Average Home Value in this Area
Purchase History
| Date | Buyer | Sale Price | Title Company |
|---|---|---|---|
| Madeline L Langan Ret | -- | -- | |
| Madeline L Langan Ret | -- | -- | |
| Madeline L Langan Ret | -- | -- |
Source: Public Records
Tax History
| Year | Tax Paid | Tax Assessment Tax Assessment Total Assessment is a certain percentage of the fair market value that is determined by local assessors to be the total taxable value of land and additions on the property. | Land | Improvement |
|---|---|---|---|---|
| 2025 | $5,963 | $399,100 | $181,200 | $217,900 |
| 2024 | $5,655 | $397,700 | $181,200 | $216,500 |
| 2023 | $5,176 | $394,500 | $178,000 | $216,500 |
| 2022 | $5,277 | $321,600 | $122,100 | $199,500 |
| 2021 | $4,944 | $271,200 | $103,700 | $167,500 |
| 2020 | $4,878 | $243,300 | $90,100 | $153,200 |
| 2019 | $4,861 | $243,300 | $90,100 | $153,200 |
| 2018 | $4,793 | $243,300 | $90,100 | $153,200 |
| 2017 | $4,777 | $238,000 | $90,100 | $147,900 |
| 2016 | $4,727 | $238,000 | $90,100 | $147,900 |
| 2015 | $4,322 | $238,000 | $90,100 | $147,900 |
| 2014 | $4,216 | $238,000 | $90,100 | $147,900 |
| 2013 | -- | $234,200 | $81,200 | $153,000 |
Source: Public Records
Map
Nearby Homes
Your Personal Tour Guide
Ask me questions while you tour the home.