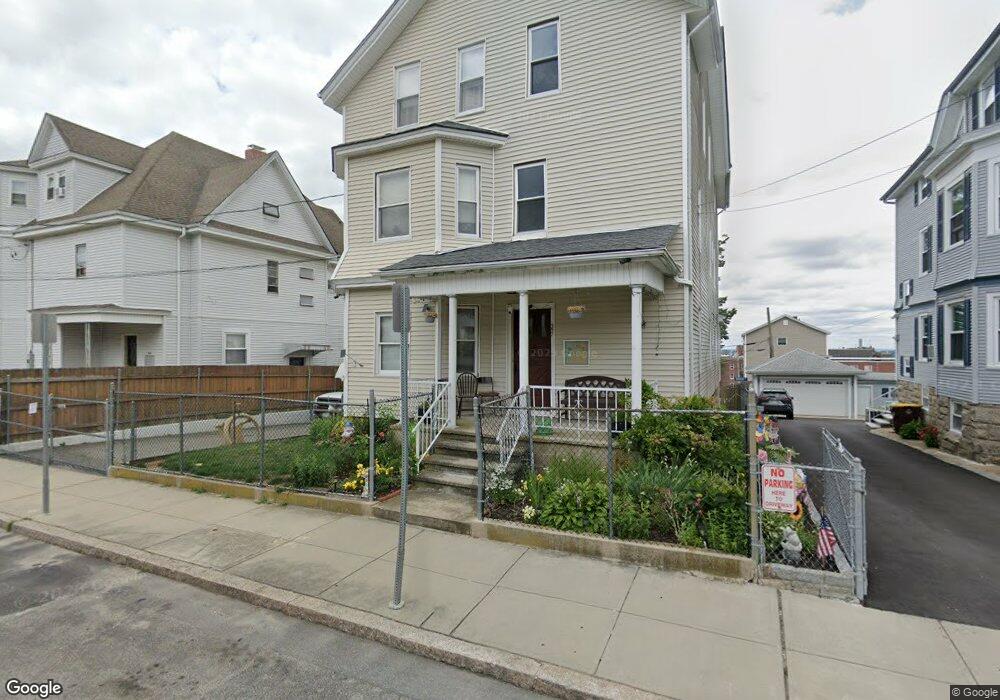
357 Whipple St Fall River, MA 02724
Corky Row NeighborhoodEstimated Value: $562,000 - $672,000
About This Home
This home is located at 357 Whipple St, Fall River, MA 02724 and is currently estimated at $623,333, approximately $197 per square foot. 357 Whipple St is a home located in Bristol County with nearby schools including Henry Lord Community School, B M C Durfee High School, and Argosy Collegiate Charter School.
Ownership History
We collect this data history from publicly available records. To have your information removed, we recommend requesting removal directly through your county’s website.
Purchase Details
Purchase Details
Purchase Details
Home Values in the Area
Average Home Value in this Area
Purchase History
We collect this data history from publicly available records. To have your information removed, we recommend requesting removal directly through your county’s website.
| Date | Buyer | Sale Price | Title Company |
|---|---|---|---|
| -- | None Available | ||
| $84,460 | -- | ||
| $116,000 | -- |
Mortgage History
We collect this data history from publicly available records. To have your information removed, we recommend requesting removal directly through your county’s website.
| Date | Status | Borrower | Loan Amount |
|---|---|---|---|
| Previous Owner | $107,000 | ||
| Previous Owner | $43,700 | ||
| Previous Owner | $14,205 |
Tax History
We collect this data history from publicly available records. To have your information removed, we recommend requesting removal directly through your county’s website.
| Year | Tax Paid | Tax Assessment Tax Assessment Total Assessment is a certain percentage of the fair market value that is determined by local assessors to be the total taxable value of land and additions on the property. | Land | Improvement |
|---|---|---|---|---|
| 2025 | $5,999 | $523,900 | $109,500 | $414,400 |
| 2024 | $5,746 | $500,100 | $105,500 | $394,600 |
| 2023 | $5,054 | $411,900 | $87,200 | $324,700 |
| 2022 | $4,500 | $356,600 | $83,000 | $273,600 |
| 2021 | $4,253 | $307,500 | $79,000 | $228,500 |
| 2020 | $3,829 | $265,000 | $77,800 | $187,200 |
| 2019 | $3,281 | $225,000 | $74,900 | $150,100 |
| 2018 | $3,165 | $216,500 | $81,200 | $135,300 |
| 2017 | $2,978 | $212,700 | $77,400 | $135,300 |
| 2016 | $2,921 | $214,300 | $82,300 | $132,000 |
| 2015 | $2,803 | $214,300 | $82,300 | $132,000 |
| 2014 | $2,818 | $224,000 | $79,900 | $144,100 |
Map
- 280 Ridge St
- 34-36 Park St
- 40 Park St
- 31 Niagara St
- 27 Cook St
- 516 Third St
- 289 5th St
- 1138 Plymouth Ave
- 283-289 Fifth St
- 1142-1144 Plymouth Ave
- 165 & 169 Grant St
- 165 Grant St
- 169 Grant St
- 155 Grant St
- 471-473 Division St
- 334 Fountain St
- 544 Plymouth Ave
- 423 Division St
- 425 Division St
- 77 Hunter St
- 367 Whipple St
- 347 Whipple St
- 379 Whipple St
- 390 Ridge St Unit 3
- 390 Ridge St Unit 1
- 390 Ridge St
- 335 Whipple St
- 376 Ridge St
- 384 Ridge St Unit 3
- 384 Ridge St
- 384 Ridge St Unit 2
- 941 Middle St
- 370 Ridge St
- 931 Middle St
- 391 Whipple St Unit 3 east
- 391 Whipple St Unit 2 W
- 391 Whipple St
- 396 Ridge St
- 325 Whipple St
- 919 Middle St
Ask me questions while you tour the home.