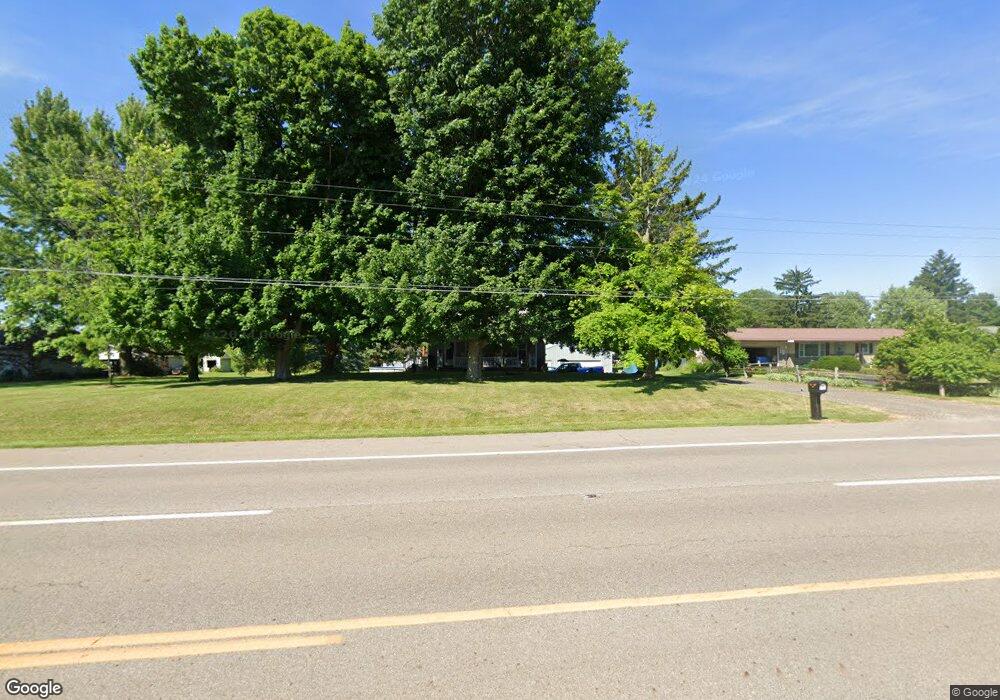
3570 State Route 39 Shelby, OH 44875
Estimated Value: $148,000 - $206,000
3
Beds
1
Bath
1,583
Sq Ft
$113/Sq Ft
Est. Value
About This Home
This home is located at 3570 State Route 39, Shelby, OH 44875 and is currently estimated at $178,893, approximately $113 per square foot. 3570 State Route 39 is a home located in Richland County with nearby schools including St. Mary's School.
Ownership History
Date
Name
Owned For
Owner Type
Purchase Details
Closed on
Jan 31, 2014
Sold by
Craig Dana M
Bought by
Craig Charles E
Current Estimated Value
Purchase Details
Closed on
Jul 25, 2011
Sold by
Bowling Vina
Bought by
Bowling Vina and Bowling Darron D
Purchase Details
Closed on
Apr 23, 2007
Sold by
Bowling Frank and Bowling Vina
Bought by
Bowling Frank and Bowling Vina
Purchase Details
Closed on
Mar 10, 1992
Sold by
Ward Kenneth A
Bought by
Craig Charles E
Create a Home Valuation Report for This Property
The Home Valuation Report is an in-depth analysis detailing your home's value as well as a comparison with similar homes in the area
Home Values in the Area
Average Home Value in this Area
Purchase History
| Date | Buyer | Sale Price | Title Company |
|---|---|---|---|
| Craig Charles E | -- | Attorney | |
| Bowling Vina | -- | Attorney | |
| Bowling Frank | -- | None Available | |
| Craig Charles E | $31,000 | -- |
Source: Public Records
Tax History Compared to Growth
Tax History
| Year | Tax Paid | Tax Assessment Tax Assessment Total Assessment is a certain percentage of the fair market value that is determined by local assessors to be the total taxable value of land and additions on the property. | Land | Improvement |
|---|---|---|---|---|
| 2024 | $1,320 | $34,760 | $8,500 | $26,260 |
| 2023 | $1,320 | $34,760 | $8,500 | $26,260 |
| 2022 | $1,260 | $29,580 | $8,210 | $21,370 |
| 2021 | $1,261 | $29,580 | $8,210 | $21,370 |
| 2020 | $1,262 | $29,580 | $8,210 | $21,370 |
| 2019 | $1,175 | $25,350 | $6,960 | $18,390 |
| 2018 | $1,151 | $25,350 | $6,960 | $18,390 |
| 2017 | $1,121 | $25,350 | $6,960 | $18,390 |
| 2016 | $1,102 | $24,730 | $5,910 | $18,820 |
| 2015 | $1,102 | $24,730 | $5,910 | $18,820 |
| 2014 | $1,057 | $24,730 | $5,910 | $18,820 |
| 2012 | $1,046 | $24,730 | $5,910 | $18,820 |
Source: Public Records
Map
Nearby Homes
- 3596 Ohio 39
- 3400 Rock Rd
- 3763 State Route 39
- 3389 Wareham Rd
- 3619 Springmill Rd N
- 0 Technology Pkwy
- 38 Woodland Rd
- 31 Sherwood Dr
- 116 Mansfield Ave
- 228 E Main St
- 226 E Main St
- 671 Bendle Ave
- 624 Bendle Ave
- 1845 Taylortown Rd
- 70 Mansfield Ave
- 221 S Gamble St
- 37 Grand Blvd
- 2392 E Smiley Rd
- 2484 E Smiley Rd
- 2674 Stiving Rd
- 3564 State Route 39
- 3574 State Route 39
- 3578 State Route 39
- 3555 State Route 39
- 3560 State Route 39
- 3558 Alvin Rd
- 3561 State Route 39
- 3582 State Route 39
- 3560 Alvin Rd
- 3556 State Route 39
- 3584 State Route 39
- 3584 Ohio 39
- 3568 Alvin Rd
- 3551 State Route 39
- 3551 Ohio 39
- 3581 State Route 39
- 3552 State Route 39
- 3588 State Route 39
- 3552 Ohio 39