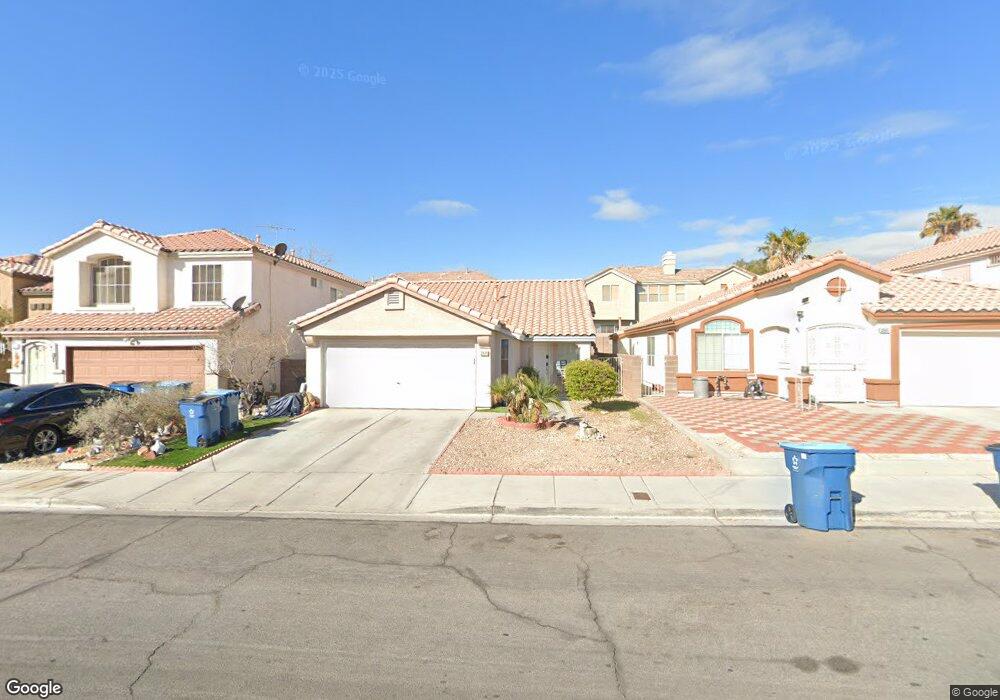
3571 Spring Shower Dr Las Vegas, NV 89147
Estimated Value: $377,000 - $396,000
3
Beds
2
Baths
1,220
Sq Ft
$320/Sq Ft
Est. Value
About This Home
This home is located at 3571 Spring Shower Dr, Las Vegas, NV 89147 and is currently estimated at $389,926, approximately $319 per square foot. 3571 Spring Shower Dr is a home located in Clark County with nearby schools including Roger M Bryan Elementary School, Clifford J Lawrence Junior High School, and Spring Valley High School.
Ownership History
Date
Name
Owned For
Owner Type
Purchase Details
Closed on
Jan 31, 2025
Sold by
Castro Marlene
Bought by
Marlene Castro Dynasty and Castro
Current Estimated Value
Purchase Details
Closed on
May 16, 2018
Sold by
Yoon David Hwan and Yoon Annie Kyong
Bought by
Castro Marlene
Home Financials for this Owner
Home Financials are based on the most recent Mortgage that was taken out on this home.
Original Mortgage
$178,500
Interest Rate
4.4%
Mortgage Type
New Conventional
Purchase Details
Closed on
Oct 15, 2009
Sold by
Yoon David Hwan
Bought by
Yoon David Hwan and Yoon Annie Kyong
Purchase Details
Closed on
Feb 24, 2005
Sold by
Yoon Kil Won
Bought by
Yoon Karen Won
Purchase Details
Closed on
Mar 21, 1994
Sold by
Lewis Homes Of Nevada
Bought by
Yoon Kil Won
Home Financials for this Owner
Home Financials are based on the most recent Mortgage that was taken out on this home.
Original Mortgage
$80,700
Interest Rate
7%
Create a Home Valuation Report for This Property
The Home Valuation Report is an in-depth analysis detailing your home's value as well as a comparison with similar homes in the area
Home Values in the Area
Average Home Value in this Area
Purchase History
| Date | Buyer | Sale Price | Title Company |
|---|---|---|---|
| Marlene Castro Dynasty | -- | None Listed On Document | |
| Castro Marlene | $210,000 | Wfg National Title Compan | |
| Yoon David Hwan | $135,492 | None Available | |
| Yoon Karen Won | -- | -- | |
| Yoon Kil Won | $101,000 | Old Republic Title Company |
Source: Public Records
Mortgage History
| Date | Status | Borrower | Loan Amount |
|---|---|---|---|
| Previous Owner | Castro Marlene | $178,500 | |
| Previous Owner | Yoon Kil Won | $80,700 |
Source: Public Records
Tax History Compared to Growth
Tax History
| Year | Tax Paid | Tax Assessment Tax Assessment Total Assessment is a certain percentage of the fair market value that is determined by local assessors to be the total taxable value of land and additions on the property. | Land | Improvement |
|---|---|---|---|---|
| 2025 | $1,806 | $81,155 | $37,100 | $44,055 |
| 2024 | $1,468 | $81,155 | $37,100 | $44,055 |
| 2023 | $1,123 | $74,265 | $32,200 | $42,065 |
| 2022 | $1,563 | $65,893 | $27,300 | $38,593 |
| 2021 | $1,447 | $59,220 | $22,400 | $36,820 |
| 2020 | $1,341 | $58,714 | $22,050 | $36,664 |
| 2019 | $1,257 | $57,582 | $21,350 | $36,232 |
| 2018 | $1,199 | $51,839 | $16,800 | $35,039 |
| 2017 | $1,464 | $49,929 | $14,350 | $35,579 |
| 2016 | $1,123 | $48,419 | $12,600 | $35,819 |
| 2015 | $1,122 | $46,296 | $11,550 | $34,746 |
| 2014 | $1,088 | $35,976 | $9,100 | $26,876 |
Source: Public Records
Map
Nearby Homes
- 3637 Pinnate Dr
- 8003 Retriever Ave
- 3634 Surfboard Ct
- 3508 Harbor Tides St
- 8109 Retriever Ave
- 3440 Meridale Dr
- 8139 Retriever Ave
- 8143 Retriever Ave
- 3749 Climbing Rose St
- 3685 Springbud Dr
- 7938 Angel Tree Ct
- 3722 Violet Rose Ct
- 7968 Dinsmore Dr
- 3372 Ceremony Dr
- 3359 Commendation Dr
- 8153 Dinsmore Dr
- 3746 Bombastic Ct
- 7954 Kentshire Dr
- 8064 Kentshire Dr
- 7959 Palace Monaco Ave
- 3571 Spring Shower Dr Unit n/a
- 3579 Spring Shower Dr
- 3565 Spring Shower Dr
- 3558 Pinnate Dr
- 3583 Spring Shower Dr
- 3557 Spring Shower Dr
- 3556 Pinnate Dr
- 3560 Pinnate Dr
- 3589 Spring Shower Dr
- 3551 Spring Shower Dr
- 3554 Pinnate Dr
- 3574 Pinnate Dr
- 3570 Spring Shower Dr
- 3564 Spring Shower Dr
- 3562 Pinnate Dr
- 3593 Spring Shower Dr
- 3580 Spring Shower Dr
- 3543 Spring Shower Dr
- 3540 Pinnate Dr
- 3556 Spring Shower Dr