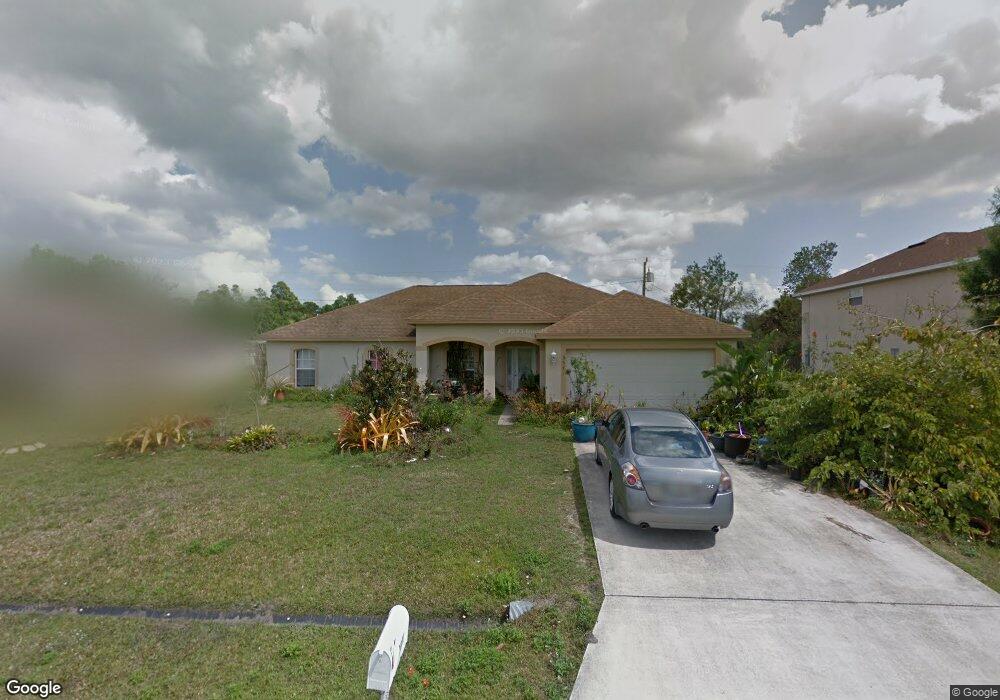
3571 SW Dellamano St Port Saint Lucie, FL 34953
Rosser Reserve NeighborhoodEstimated Value: $389,104 - $433,000
3
Beds
2
Baths
1,880
Sq Ft
$220/Sq Ft
Est. Value
About This Home
This home is located at 3571 SW Dellamano St, Port Saint Lucie, FL 34953 and is currently estimated at $414,526, approximately $220 per square foot. 3571 SW Dellamano St is a home located in St. Lucie County with nearby schools including Windmill Point Elementary School, Oak Hammock K-8 School, and Bayshore Elementary School.
Ownership History
Date
Name
Owned For
Owner Type
Purchase Details
Closed on
Nov 16, 2015
Sold by
Rehc Inc
Bought by
Frasca Grace
Current Estimated Value
Home Financials for this Owner
Home Financials are based on the most recent Mortgage that was taken out on this home.
Original Mortgage
$166,920
Outstanding Balance
$134,742
Interest Rate
4.75%
Mortgage Type
FHA
Estimated Equity
$279,784
Purchase Details
Closed on
Mar 24, 2010
Sold by
Cobia Homes Inc
Bought by
Rehc Inc
Purchase Details
Closed on
Aug 31, 2007
Sold by
Calles Edward C
Bought by
Cobia Homes Inc
Purchase Details
Closed on
Dec 30, 2006
Sold by
Panagiotopoulos Jean J and Panagiotopoulos Georgia
Bought by
Calles Edward C
Purchase Details
Closed on
Jan 3, 2003
Sold by
Rosenberg Bruce
Bought by
Sangster Ward Charmaine and Chin Joseph
Purchase Details
Closed on
Nov 25, 2002
Sold by
Panagiotopoulos Jean J and Panagiotopoulos Geogia
Bought by
Rosenberg Bruce
Create a Home Valuation Report for This Property
The Home Valuation Report is an in-depth analysis detailing your home's value as well as a comparison with similar homes in the area
Home Values in the Area
Average Home Value in this Area
Purchase History
| Date | Buyer | Sale Price | Title Company |
|---|---|---|---|
| Frasca Grace | $170,000 | Attorney | |
| Rehc Inc | -- | None Available | |
| Cobia Homes Inc | $33,000 | St Lucie Title Services Inc | |
| Calles Edward C | -- | None Available | |
| Sangster Ward Charmaine | $11,500 | -- | |
| Rosenberg Bruce | $3,100 | -- |
Source: Public Records
Mortgage History
| Date | Status | Borrower | Loan Amount |
|---|---|---|---|
| Open | Frasca Grace | $166,920 |
Source: Public Records
Tax History Compared to Growth
Tax History
| Year | Tax Paid | Tax Assessment Tax Assessment Total Assessment is a certain percentage of the fair market value that is determined by local assessors to be the total taxable value of land and additions on the property. | Land | Improvement |
|---|---|---|---|---|
| 2025 | $3,960 | $197,491 | -- | -- |
| 2024 | $3,871 | $191,926 | -- | -- |
| 2023 | $3,871 | $186,336 | $0 | $0 |
| 2022 | $3,720 | $180,909 | $0 | $0 |
| 2021 | $3,644 | $175,640 | $0 | $0 |
| 2020 | $3,666 | $173,215 | $0 | $0 |
| 2019 | $3,631 | $169,321 | $0 | $0 |
| 2018 | $3,455 | $166,164 | $0 | $0 |
| 2017 | $3,640 | $170,300 | $29,200 | $141,100 |
| 2016 | $3,593 | $159,400 | $25,000 | $134,400 |
| 2015 | $3,768 | $123,600 | $15,000 | $108,600 |
| 2014 | $3,327 | $108,680 | $0 | $0 |
Source: Public Records
Map
Nearby Homes
- 3519 SW Margela St
- 3682 SW Margela St
- 3532 SW Carmody St
- 3631 SW Kromrey St
- 1612 SW Penrose Ave
- 1456 SW Patricia Ave
- 1214 SW Medina Ave
- 1682 SW Lofgren Ave
- 3785 SW Ottawa St
- 3557 SW Rosser Blvd
- 3873 SW Rosser Blvd
- 3097 SW Rosser Blvd
- 3792 SW Hulska St
- 1702 SW Penrose Ave
- 3799 SW Ottawa St
- 1701 SW Penrose Ave
- 1542 SW Dycus Ave
- 3663 SW Ballweg St
- 1298 SW Patricia Ave
- 1273 SW Glastonberry Ave
- 3561 SW Dellamano St
- 3581 SW Dellamano St
- 3572 SW Vollmer St Unit PTSTLU
- 3572 SW Vollmer St
- 3562 SW Vollmer St
- 3582 SW Vollmer St
- 3572 SW Dellamano St
- 3551 SW Dellamano St
- 3582 SW Dellamano St
- 3552 SW Vollmer St
- 3562 SW Dellamano St
- 3592 SW Vollmer St
- 3542 SW Dellamano St
- 1441 SW Maywall Ave
- 3542 SW Vollmer St
- 1451 SW Maywall Ave
- 3541 SW Dellamano St
- 1461 SW Maywall Ave
- 3571 SW Margela St
- 3573 SW Vollmer St