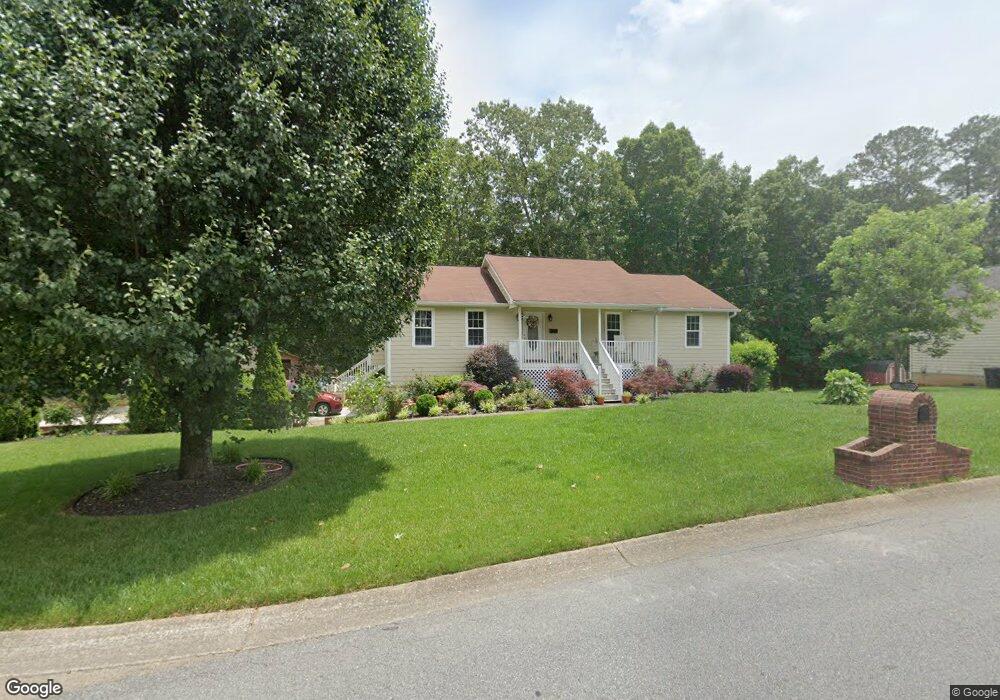
3572 Cherokee Overlook Dr Unit I Canton, GA 30115
Estimated Value: $310,000 - $320,587
3
Beds
2
Baths
1,352
Sq Ft
$233/Sq Ft
Est. Value
About This Home
This home is located at 3572 Cherokee Overlook Dr Unit I, Canton, GA 30115 and is currently estimated at $315,294, approximately $233 per square foot. 3572 Cherokee Overlook Dr Unit I is a home located in Cherokee County with nearby schools including Indian Knoll Elementary School, Rusk Middle School, and Sequoyah High School.
Ownership History
Date
Name
Owned For
Owner Type
Purchase Details
Closed on
Jul 31, 2010
Sold by
Urdaneta Yasmin D L
Bought by
J M House Corp
Current Estimated Value
Purchase Details
Closed on
Nov 29, 2001
Sold by
Bustos Armando Z
Bought by
Betancourt Armando Z and Betancourt Rosa N
Home Financials for this Owner
Home Financials are based on the most recent Mortgage that was taken out on this home.
Original Mortgage
$117,075
Interest Rate
6.49%
Mortgage Type
FHA
Purchase Details
Closed on
Mar 12, 2001
Sold by
Holbrook Tommy R and Holbrook Barbara A
Bought by
Holbrook Tommy R and Holbrook Barbara A
Home Financials for this Owner
Home Financials are based on the most recent Mortgage that was taken out on this home.
Original Mortgage
$103,900
Interest Rate
7.02%
Mortgage Type
New Conventional
Create a Home Valuation Report for This Property
The Home Valuation Report is an in-depth analysis detailing your home's value as well as a comparison with similar homes in the area
Home Values in the Area
Average Home Value in this Area
Purchase History
| Date | Buyer | Sale Price | Title Company |
|---|---|---|---|
| J M House Corp | -- | -- | |
| Betancourt Armando Z | -- | -- | |
| Bustos Aramando Z | $118,000 | -- | |
| Holbrook Tommy R | -- | -- |
Source: Public Records
Mortgage History
| Date | Status | Borrower | Loan Amount |
|---|---|---|---|
| Previous Owner | Bustos Aramando Z | $117,075 | |
| Previous Owner | Holbrook Tommy R | $103,900 |
Source: Public Records
Tax History Compared to Growth
Tax History
| Year | Tax Paid | Tax Assessment Tax Assessment Total Assessment is a certain percentage of the fair market value that is determined by local assessors to be the total taxable value of land and additions on the property. | Land | Improvement |
|---|---|---|---|---|
| 2025 | $3,131 | $108,812 | $26,000 | $82,812 |
| 2024 | $3,047 | $106,452 | $24,400 | $82,052 |
| 2023 | $3,260 | $113,892 | $24,400 | $89,492 |
| 2022 | $2,521 | $87,852 | $19,200 | $68,652 |
| 2021 | $2,153 | $70,608 | $14,400 | $56,208 |
| 2020 | $1,899 | $62,208 | $12,800 | $49,408 |
| 2019 | $1,839 | $60,200 | $12,800 | $47,400 |
| 2018 | $1,660 | $54,040 | $12,000 | $42,040 |
| 2017 | $1,617 | $130,800 | $12,000 | $40,320 |
| 2016 | $1,104 | $107,200 | $10,000 | $32,880 |
| 2015 | $967 | $93,100 | $8,800 | $28,440 |
| 2014 | $1,093 | $84,800 | $8,000 | $25,920 |
Source: Public Records
Map
Nearby Homes
- 3548 Cherokee Overlook Dr
- 3714 Cherokee Overlook Dr Unit 2
- 201 Hillcrest Ridge
- 832 Overlook Trail
- 365 Russell King Ln
- 254 Hillcrest Ridge Unit 2
- 209 Forest Trace
- 809 Overlook Trail
- 3789 Cherokee Overlook Dr
- 240 Rose Ridge Dr
- 253 Newt Fowler Ln
- 231 Breeze Hill Ln
- 2790 Hickory Flat Hwy
- 302 and 304 Garland Way
- 0 Reed St Unit 7646438
- 160 Scott Rd
- 701 Longview Dr
- 0 Governors Walk Dr Unit 7294252
- 1200 Tom Hulsey Dr
- 0 Avery Rd Unit 10456365
- 3560 Cherokee Overlook Dr Unit 1
- 3588 Cherokee Overlook Dr
- 3565 Cherokee Overlook Dr
- 3565 Cherokee Overlook Dr
- 3575 Cherokee Overlook Dr
- 3585 Cherokee Overlook Dr
- 3545 Cherokee Overlook Dr
- 3600 Cherokee Overlook Dr
- 3597 Cherokee Overlook Dr
- 3536 Cherokee Overlook Dr Unit 1
- 1103 Lightfoot Dr
- 3612 Cherokee Overlook Dr
- 1113 Lightfoot Dr
- 1123 Lightfoot Dr
- 3609 Cherokee Overlook Dr Unit 1
- 3524 Cherokee Overlook Dr
- 3624 Cherokee Overlook Dr
- 1133 Lightfoot Dr
- 421 Lightfoot Ct
- 411 Lightfoot Ct