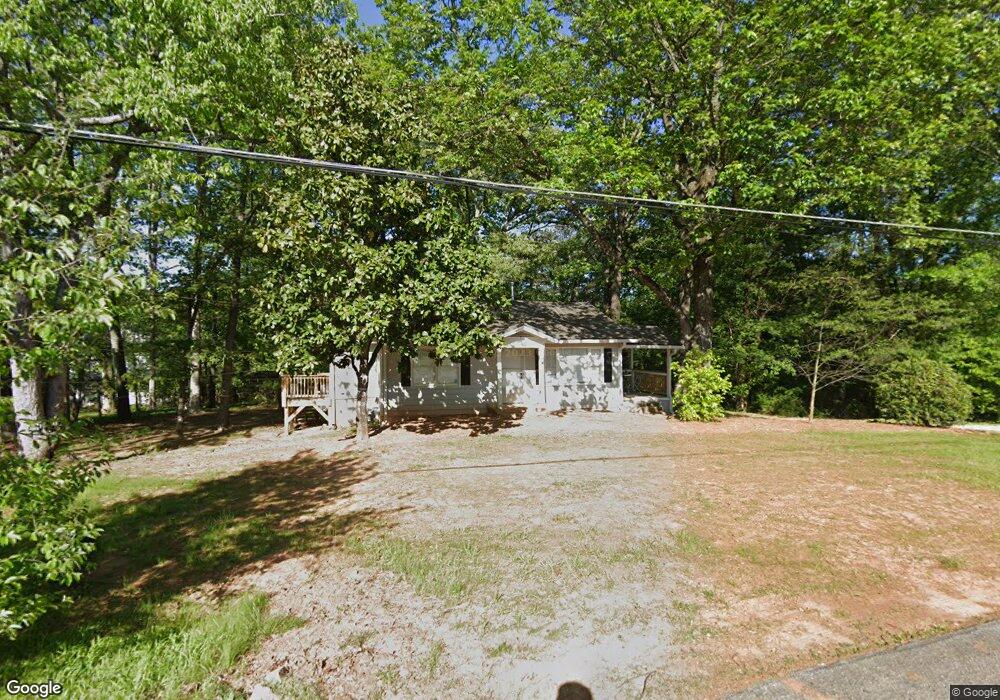
3574 South St Duluth, GA 30096
Estimated Value: $282,000 - $344,000
2
Beds
1
Bath
1,080
Sq Ft
$287/Sq Ft
Est. Value
About This Home
This home is located at 3574 South St, Duluth, GA 30096 and is currently estimated at $309,847, approximately $286 per square foot. 3574 South St is a home located in Gwinnett County with nearby schools including Chattahoochee Elementary School, Coleman Middle School, and Duluth High School.
Ownership History
Date
Name
Owned For
Owner Type
Purchase Details
Closed on
Jun 17, 2022
Sold by
Brimer Construction Inc
Bought by
Marshall Elliot
Current Estimated Value
Home Financials for this Owner
Home Financials are based on the most recent Mortgage that was taken out on this home.
Original Mortgage
$308,000
Outstanding Balance
$292,173
Interest Rate
5.25%
Mortgage Type
New Conventional
Estimated Equity
$17,674
Purchase Details
Closed on
May 17, 2022
Sold by
Antunes Luciana Kelly
Bought by
Cke Properties Llc
Home Financials for this Owner
Home Financials are based on the most recent Mortgage that was taken out on this home.
Original Mortgage
$308,000
Outstanding Balance
$292,173
Interest Rate
5.25%
Mortgage Type
New Conventional
Estimated Equity
$17,674
Purchase Details
Closed on
Jun 10, 2021
Sold by
Burel Michael
Bought by
Brimer Construction Inc
Purchase Details
Closed on
May 21, 2007
Sold by
Boles Family Investments Llc
Bought by
Burel Michael and Burel Judy
Create a Home Valuation Report for This Property
The Home Valuation Report is an in-depth analysis detailing your home's value as well as a comparison with similar homes in the area
Home Values in the Area
Average Home Value in this Area
Purchase History
| Date | Buyer | Sale Price | Title Company |
|---|---|---|---|
| Marshall Elliot | $330,000 | -- | |
| Cke Properties Llc | $567,000 | -- | |
| Brimer Construction Inc | $190,000 | -- | |
| Burel Michael | $68,000 | -- |
Source: Public Records
Mortgage History
| Date | Status | Borrower | Loan Amount |
|---|---|---|---|
| Open | Marshall Elliot | $308,000 |
Source: Public Records
Tax History
| Year | Tax Paid | Tax Assessment Tax Assessment Total Assessment is a certain percentage of the fair market value that is determined by local assessors to be the total taxable value of land and additions on the property. | Land | Improvement |
|---|---|---|---|---|
| 2025 | $539 | $81,280 | $29,920 | $51,360 |
| 2024 | $1,798 | $70,560 | $28,000 | $42,560 |
| 2023 | $1,798 | $70,560 | $28,000 | $42,560 |
| 2022 | $1,501 | $46,760 | $15,600 | $31,160 |
| 2021 | $1,534 | $46,760 | $15,600 | $31,160 |
| 2020 | $1,545 | $46,760 | $15,600 | $31,160 |
| 2019 | $1,959 | $40,400 | $15,600 | $24,800 |
| 2018 | $1,338 | $40,400 | $15,600 | $24,800 |
| 2016 | $899 | $27,200 | $15,160 | $12,040 |
| 2015 | $1,111 | $27,200 | $15,160 | $12,040 |
| 2014 | $1,372 | $40,664 | $12,886 | $27,778 |
Source: Public Records
Map
Nearby Homes
- 3590 North St
- 3592 North St
- 2755 Pine St
- 2988 First St
- 3607 W Lawrenceville St
- 3132 Hill St NW Unit 1
- 3706 Thornbrooke Ct
- 2825 Pine St
- 2643 Timberbrooke Place
- 2605 River Summit Dr
- 3598 Parkridge Pointe
- 2648 Baxter Pines Way
- 3880 Gallant Fox Ct
- 3325 River Summit Trail
- 3207 Hill St
- 2711 Old Coach Rd
- 3081 Frankie Ln
- 3460 Hardy St
- 3614 Clearbrooke Way
- 2629 Kensington Dr
Your Personal Tour Guide
Ask me questions while you tour the home.