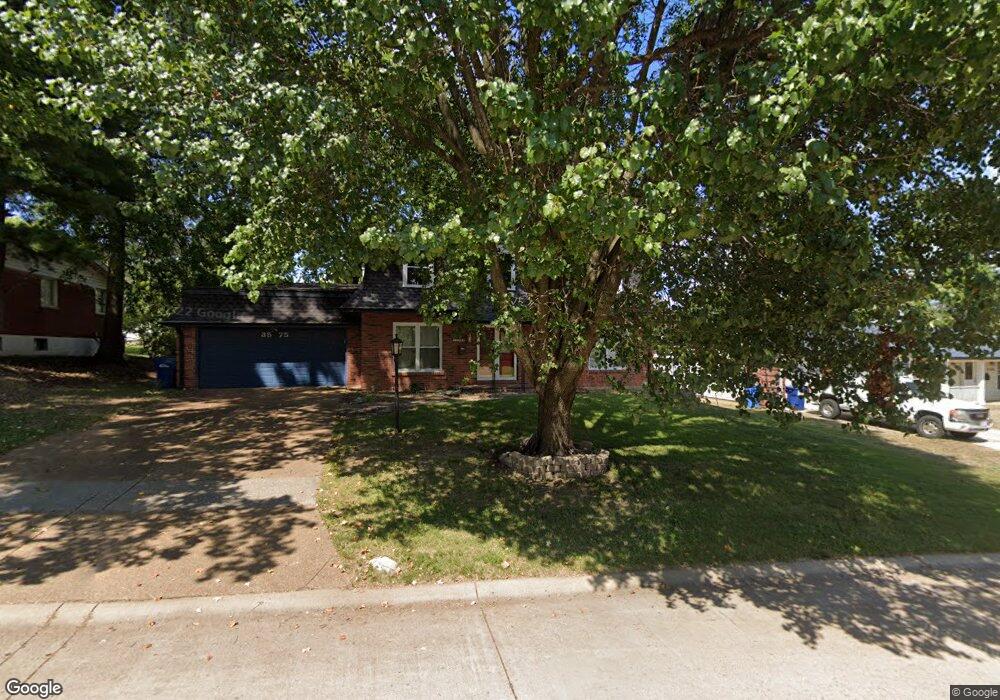
3575 Brookstone Dr Florissant, MO 63033
Estimated Value: $221,013 - $260,000
4
Beds
3
Baths
2,128
Sq Ft
$113/Sq Ft
Est. Value
About This Home
This home is located at 3575 Brookstone Dr, Florissant, MO 63033 and is currently estimated at $240,503, approximately $113 per square foot. 3575 Brookstone Dr is a home located in St. Louis County with nearby schools including Commons Lane Elementary School, Cross Keys Middle School, and McCluer North High School.
Ownership History
Date
Name
Owned For
Owner Type
Purchase Details
Closed on
Sep 21, 2022
Sold by
Mabry Rickey T and Mabry Laura B
Bought by
Assegai Group Llc
Current Estimated Value
Purchase Details
Closed on
Mar 4, 2020
Sold by
Alabama Housing Finance Authority
Bought by
Mabry Rickey and Mabry Laura
Home Financials for this Owner
Home Financials are based on the most recent Mortgage that was taken out on this home.
Original Mortgage
$80,000
Interest Rate
3.5%
Mortgage Type
New Conventional
Purchase Details
Closed on
May 2, 2019
Sold by
Walker Cheryl
Bought by
Alabama Housing Finance Authority
Purchase Details
Closed on
Nov 22, 2013
Sold by
Finneran Thomas
Bought by
Walker Cheryl
Home Financials for this Owner
Home Financials are based on the most recent Mortgage that was taken out on this home.
Original Mortgage
$106,150
Interest Rate
4.87%
Mortgage Type
FHA
Create a Home Valuation Report for This Property
The Home Valuation Report is an in-depth analysis detailing your home's value as well as a comparison with similar homes in the area
Home Values in the Area
Average Home Value in this Area
Purchase History
| Date | Buyer | Sale Price | Title Company |
|---|---|---|---|
| Assegai Group Llc | -- | -- | |
| Mabry Rickey | $160,000 | Community Title Services Llc | |
| Alabama Housing Finance Authority | $106,860 | None Available | |
| Walker Cheryl | $110,000 | Freedom Title Llc St Louis |
Source: Public Records
Mortgage History
| Date | Status | Borrower | Loan Amount |
|---|---|---|---|
| Previous Owner | Mabry Rickey | $80,000 | |
| Previous Owner | Walker Cheryl | $106,150 |
Source: Public Records
Tax History Compared to Growth
Tax History
| Year | Tax Paid | Tax Assessment Tax Assessment Total Assessment is a certain percentage of the fair market value that is determined by local assessors to be the total taxable value of land and additions on the property. | Land | Improvement |
|---|---|---|---|---|
| 2025 | $2,208 | $43,390 | $5,830 | $37,560 |
| 2024 | $2,208 | $28,500 | $3,840 | $24,660 |
| 2023 | $3,199 | $41,730 | $3,840 | $37,890 |
| 2022 | $2,086 | $23,750 | $5,830 | $17,920 |
| 2021 | $2,051 | $32,730 | $5,830 | $26,900 |
| 2020 | $2,700 | $29,520 | $5,830 | $23,690 |
| 2019 | $2,648 | $29,520 | $5,830 | $23,690 |
| 2018 | $2,476 | $24,650 | $1,750 | $22,900 |
| 2017 | $2,463 | $24,650 | $1,750 | $22,900 |
| 2016 | $2,019 | $19,650 | $2,510 | $17,140 |
| 2015 | $2,031 | $19,650 | $2,510 | $17,140 |
| 2014 | $2,239 | $22,400 | $4,220 | $18,180 |
Source: Public Records
Map
Nearby Homes
- 3515 Saint Catherine St
- 3435 Saint Catherine St
- 3475 Stonehaven Dr
- 990 Saddle Dr
- 2520 Greenberry Dr
- 670 Hargrove Ln
- 2320 Greenberry Dr
- 3140 Saint Catherine St
- 3270 Kingsley Dr
- 1945 Pohlman Rd
- 3940 Parker Rd
- 2255 Wheatfield Dr
- 3150 Parker Rd
- 3190 N Waterford Dr
- 100 Broadmere Dr
- 1540 Ascot Terrace
- 4040 Helmkampf Dr
- 12415 Danube Dr
- 3905 Max-Weich Place
- 3870 Woodcrest Dr
- 3555 Brookstone Dr
- 3595 Brookstone Dr
- 3570 Bradstone Dr
- 3590 Bradstone Dr
- 3550 Bradstone Dr
- 3535 Brookstone Dr
- 3605 Brookstone Dr
- 3550 Brookstone Dr
- 3570 Brookstone Dr
- 3600 Bradstone Dr
- 3530 Bradstone Dr
- 615 Creststone Dr
- 3610 Bradstone Dr
- 620 Millstone Dr
- 3615 Brookstone Dr
- 3510 Brookstone Dr
- 630 Millstone Dr
- 3575 Bradstone Dr
- 3575 Saint Catherine St