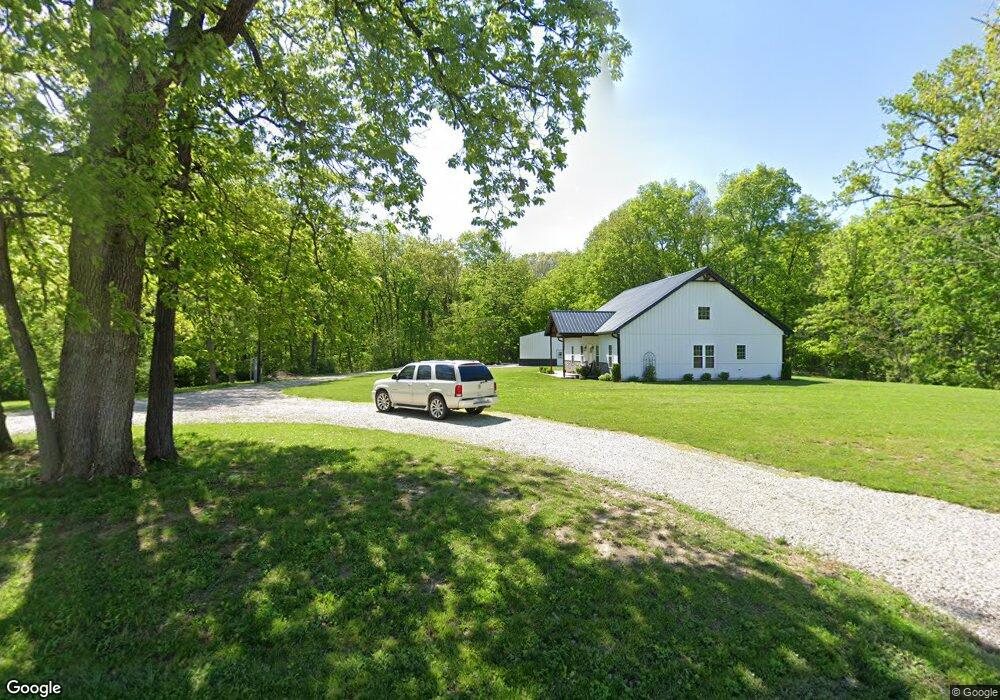
3575 N County Road 330e Mattoon, IL 61938
Estimated Value: $120,000 - $195,418
3
Beds
2
Baths
2,133
Sq Ft
$79/Sq Ft
Est. Value
About This Home
This home is located at 3575 N County Road 330e, Mattoon, IL 61938 and is currently estimated at $168,806, approximately $79 per square foot. 3575 N County Road 330e is a home located in Coles County with nearby schools including Mattoon High School.
Ownership History
Date
Name
Owned For
Owner Type
Purchase Details
Closed on
Feb 17, 2023
Sold by
Tucker Christopher J and Tucker Jennifer L
Bought by
Kauffman Ervin E and Kauffman Katelyn A
Current Estimated Value
Home Financials for this Owner
Home Financials are based on the most recent Mortgage that was taken out on this home.
Original Mortgage
$94,293
Outstanding Balance
$75,433
Interest Rate
6.48%
Mortgage Type
New Conventional
Estimated Equity
$93,373
Purchase Details
Closed on
May 29, 2020
Sold by
Shupe Justin and Shupe Jennifer
Bought by
Tucker Christopher J and Dittamore Jennifer L
Purchase Details
Closed on
Mar 1, 2019
Sold by
Zimmer Nathan P and Zimmer Katherine D
Bought by
Shupe Justin and Shupe Jennifer
Purchase Details
Closed on
Jun 6, 2018
Sold by
Regions Bank
Bought by
Zimmer Nathan P and Zimmer Katherine D
Purchase Details
Closed on
May 25, 2018
Sold by
Realtax Developers Ltd
Bought by
Regions Bank Trt
Purchase Details
Closed on
May 14, 2018
Sold by
Coles County Sheriff
Bought by
Realtax Developers Ltd
Create a Home Valuation Report for This Property
The Home Valuation Report is an in-depth analysis detailing your home's value as well as a comparison with similar homes in the area
Home Values in the Area
Average Home Value in this Area
Purchase History
| Date | Buyer | Sale Price | Title Company |
|---|---|---|---|
| Kauffman Ervin E | $58,000 | -- | |
| Tucker Christopher J | $44,000 | Attorney | |
| Shupe Justin | $50,000 | None Available | |
| Zimmer Nathan P | $15,000 | None Available | |
| Regions Bank Trt | $9,500 | -- | |
| Realtax Developers Ltd | -- | None Available |
Source: Public Records
Mortgage History
| Date | Status | Borrower | Loan Amount |
|---|---|---|---|
| Open | Kauffman Ervin E | $94,293 |
Source: Public Records
Tax History Compared to Growth
Tax History
| Year | Tax Paid | Tax Assessment Tax Assessment Total Assessment is a certain percentage of the fair market value that is determined by local assessors to be the total taxable value of land and additions on the property. | Land | Improvement |
|---|---|---|---|---|
| 2024 | $3,852 | $60,739 | $5,969 | $54,770 |
| 2023 | $963 | $14,587 | $5,426 | $9,161 |
| 2022 | $945 | $14,346 | $5,336 | $9,010 |
| 2021 | $518 | $7,102 | $5,082 | $2,020 |
| 2020 | $514 | $7,358 | $5,265 | $2,093 |
| 2019 | $505 | $7,102 | $5,082 | $2,020 |
| 2018 | $1,135 | $16,196 | $5,082 | $11,114 |
| 2017 | $1,513 | $21,422 | $5,082 | $16,340 |
| 2016 | $1,494 | $21,422 | $5,082 | $16,340 |
| 2015 | $2,818 | $21,002 | $4,982 | $16,020 |
| 2014 | $2,818 | $21,002 | $4,982 | $16,020 |
| 2013 | $2,818 | $45,687 | $4,982 | $40,705 |
Source: Public Records
Map
Nearby Homes
- 3221 E Lake Paradise Rd
- 3475 E Lake Paradise Rd
- 2822 N Co Road 330e
- 9 Joan Marie Dr
- 2376 N County Road 190e
- 2921 Oak Ave
- 3512 Walnut Ave
- 1105 Stinson Ave
- 3304 Marion Ave
- 1821 Dakota Ave
- 3105 Marshall Ave
- 421 Parkview Ave
- 1005 Lake Land Blvd
- 1604 S 9th St
- 1208 S 12th St
- 1612 Westgate Ln
- 1017 S 14th St
- 1009 S 14th St
- 2801 Commercial Ave
- 900 S 14th St
- 3663CTY N County Road 330e
- 3154 E County Road 360n
- 3663 N County Road 330e
- 3663 N County Road 330e
- 3185 E County Road 360n
- 3185 E County Road 360n
- 3689 N County Road 330e
- 3689 N County Road 330e
- 3689 N County Road 330e
- 3689 N County Road 330e
- 3687 N County Road 330e
- 3687 N Co Road 330e
- 3712 N County Road 330e
- 3444 N County Road 330e
- 3007 E County Road 360n
- 3780 N County Road 330e
- 3266 N County Road 330e
- 3262 Paradise Rd
- 3174 Paradise Rd
- 3179 Paradise Rd