3575 Wabash St Denver, CO 80238
Central Park NeighborhoodEstimated Value: $975,000 - $1,096,000
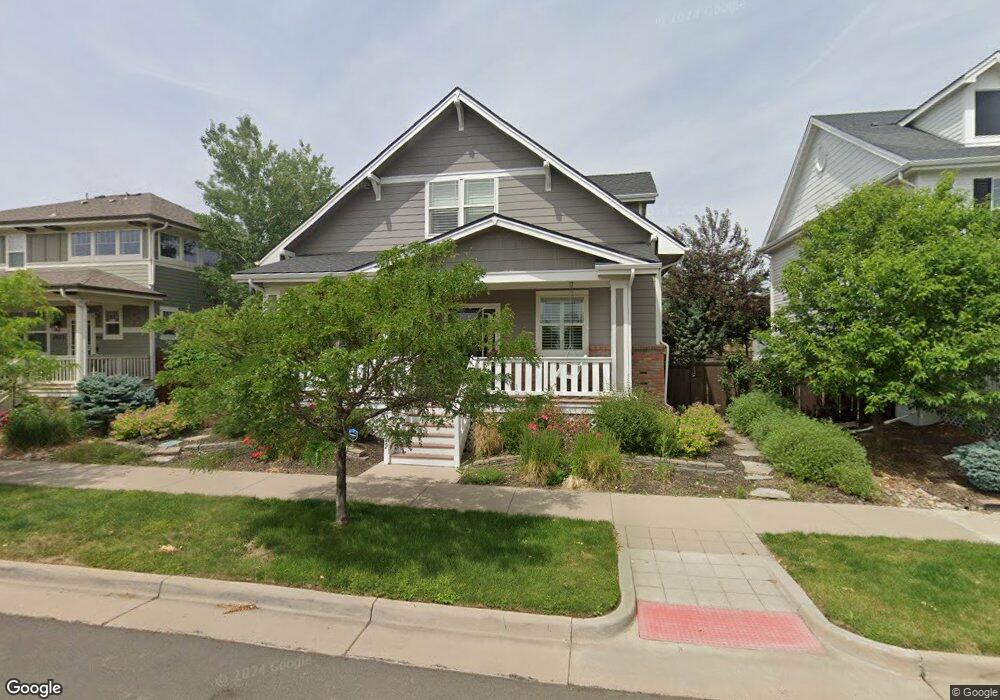
About This Home
This home is located at 3575 Wabash St, Denver, CO 80238 and is currently estimated at $1,024,057, approximately $304 per square foot. 3575 Wabash St is a home located in Denver County with nearby schools including Swigert International School, Westerly Creek Elementary, and William (Bill) Roberts ECE-8 School.
Ownership History
We collect this data history from publicly available records. To have your information removed, we recommend requesting removal directly through your county’s website.
Purchase Details
Home Financials for this Owner
Home Financials are based on the most recent Mortgage that was taken out on this home.Purchase Details
Home Financials for this Owner
Home Financials are based on the most recent Mortgage that was taken out on this home.Purchase Details
Home Values in the Area
Average Home Value in this Area
Purchase History
We collect this data history from publicly available records. To have your information removed, we recommend requesting removal directly through your county’s website.
| Date | Buyer | Sale Price | Title Company |
|---|---|---|---|
| $525,000 | Stewart Title | ||
| $457,415 | Land Title Guarantee Company | ||
| $552,000 | Land Title |
Mortgage History
We collect this data history from publicly available records. To have your information removed, we recommend requesting removal directly through your county’s website.
| Date | Status | Borrower | Loan Amount |
|---|---|---|---|
| Open | $417,000 | ||
| Previous Owner | $365,932 |
Tax History
We collect this data history from publicly available records. To have your information removed, we recommend requesting removal directly through your county’s website.
| Year | Tax Paid | Tax Assessment Tax Assessment Total Assessment is a certain percentage of the fair market value that is determined by local assessors to be the total taxable value of land and additions on the property. | Land | Improvement |
|---|---|---|---|---|
| 2025 | $9,888 | $72,050 | $12,650 | $12,650 |
| 2024 | $9,561 | $65,350 | $8,330 | $57,020 |
| 2023 | $9,433 | $65,350 | $8,330 | $57,020 |
| 2022 | $7,218 | $51,080 | $12,470 | $38,610 |
| 2021 | $7,120 | $52,550 | $12,830 | $39,720 |
| 2020 | $6,943 | $51,830 | $12,830 | $39,000 |
| 2019 | $6,838 | $51,830 | $12,830 | $39,000 |
| 2018 | $6,159 | $44,770 | $11,070 | $33,700 |
| 2017 | $6,149 | $44,770 | $11,070 | $33,700 |
| 2016 | $6,321 | $45,660 | $9,186 | $36,474 |
| 2015 | $6,153 | $45,660 | $9,186 | $36,474 |
| 2014 | $5,435 | $39,090 | $8,581 | $30,509 |
Map
- 8476 E 35th Ave
- 3444 Wabash St
- 3596 Wabash St
- 3456 Willow St
- 3450 Uinta St
- 3551 Yosemite St
- 3561 Yosemite St
- 3453 Yosemite St
- 3564 Yosemite St
- 8161 E 33rd Ave
- 3416 Akron St
- 8189 E 32nd Ave
- 8994 E Martin Luther King Junior Blvd
- 5217 E Martin Luther King Junior Blvd
- 6825 E Martin Luther King Junior Blvd
- 8323 E 29th Place
- 8873 E 29th Place Unit A
- 3033 Tamarac St
- 3219 Spruce St
- 3031 Trenton St
- 8508 E 35th Place
- 8508 35th Place
- 8558 E 35th Place
- 8517 E 35th Ave
- 8598 E 35th Place
- 8598 35th Place
- 3543 Wabash St
- 3551 Wabash St
- 8557 E 35th Ave
- 8497 E 35th Ave
- 3553 Wabash St
- 8477 E 35th Ave
- 8577 E 35th Ave
- 8497 35th Ave
- 3573 Wabash St
- 8467 E 35th Ave
- 8467 35th Ave
- 3563 Wabash St
- 8457 E 35th Ave
- 8457 35th Ave
Ask me questions while you tour the home.