3578 Maple Ct Oceanside, NY 11572
Estimated Value: $885,951
Studio
--
Bath
13,500
Sq Ft
$66/Sq Ft
Est. Value
About This Home
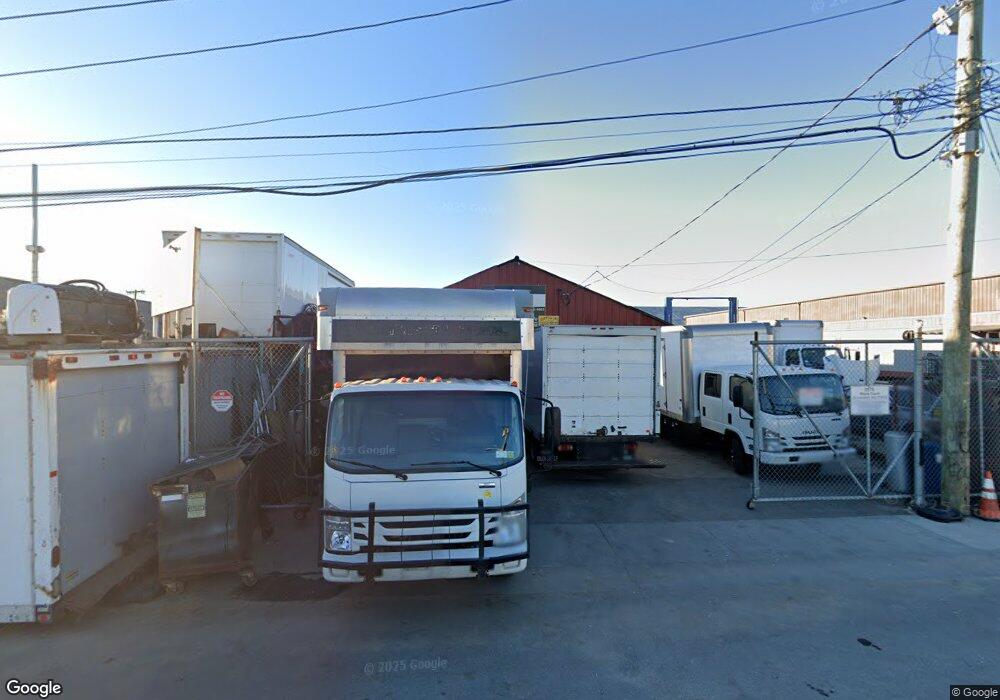
This home is located at 3578 Maple Ct, Oceanside, NY 11572 and is currently estimated at $885,951, approximately $65 per square foot. 3578 Maple Ct is a home located in Nassau County with nearby schools including Fulton Avenue Elementary - School 8, Oceanside Middle School, and Oceanside High School.
Ownership History
Date
Name
Owned For
Owner Type
Purchase Details
Closed on
Aug 23, 2023
Sold by
Maple Barry Property Mgmt Llc
Bought by
3578 Maple Court Llc
Current Estimated Value
Purchase Details
Closed on
Feb 14, 2017
Sold by
Moret Partnership
Bought by
Maple Barry Property Mgmt Llc
Purchase Details
Closed on
Apr 19, 2004
Sold by
Weisman Harvey
Purchase Details
Closed on
Jul 8, 2003
Sold by
Treasurer
Purchase Details
Closed on
Sep 22, 2000
Sold by
Allens Lane Corp
Bought by
Nassau Truck Parts Inc
Purchase Details
Closed on
Oct 21, 1999
Sold by
Rtl Trust & Republic National Bank Of Ny
Bought by
Allens Lane Corp
Create a Home Valuation Report for This Property
The Home Valuation Report is an in-depth analysis detailing your home's value as well as a comparison with similar homes in the area
Home Values in the Area
Average Home Value in this Area
Purchase History
| Date | Buyer | Sale Price | Title Company |
|---|---|---|---|
| 3578 Maple Court Llc | $800,000 | Old Republic Natl Ttl Ins Co | |
| 3578 Maple Court Llc | $800,000 | Old Republic Natl Ttl Ins Co | |
| 3578 Maple Court Llc | $800,000 | Old Republic Natl Ttl Ins Co | |
| Maple Barry Property Mgmt Llc | -- | Judicial Title | |
| Maple Barry Property Mgmt Llc | -- | Judicial Title | |
| Maple Barry Property Mgmt Llc | -- | Judicial Title | |
| -- | $85,000 | -- | |
| -- | $85,000 | -- | |
| -- | $48,630 | -- | |
| -- | $48,630 | -- | |
| Nassau Truck Parts Inc | $110,000 | Richard Handler | |
| Nassau Truck Parts Inc | $110,000 | Richard Handler | |
| Allens Lane Corp | -- | -- | |
| Allens Lane Corp | -- | -- |
Source: Public Records
Tax History
| Year | Tax Paid | Tax Assessment Tax Assessment Total Assessment is a certain percentage of the fair market value that is determined by local assessors to be the total taxable value of land and additions on the property. | Land | Improvement |
|---|---|---|---|---|
| 2025 | $26,474 | $3,601 | $2,915 | $686 |
| 2024 | $10,038 | $3,383 | $2,739 | $644 |
| 2023 | $23,275 | $3,601 | $2,915 | $686 |
| 2022 | $23,275 | $3,601 | $2,915 | $686 |
| 2021 | $28,452 | $3,601 | $2,915 | $686 |
| 2020 | $49,795 | $3,984 | $3,793 | $191 |
| 2019 | $36,015 | $3,984 | $3,793 | $191 |
| 2018 | $34,648 | $3,984 | $0 | $0 |
| 2017 | $16,383 | $3,984 | $3,793 | $191 |
| 2016 | $33,633 | $3,984 | $3,793 | $191 |
| 2015 | $12,527 | $3,984 | $3,793 | $191 |
| 2014 | $12,527 | $3,984 | $3,793 | $191 |
| 2013 | $11,655 | $3,984 | $3,793 | $191 |
Source: Public Records
Map
Nearby Homes
- 584 Yale St
- 3354 Murdock Ave
- 3337 Murdock Ave
- 3356 Weidner Ave
- 3340 Yost Blvd
- 100 Daly Blvd Unit 408
- 100 Daly Blvd Unit 1402
- 100 Daly Blvd Unit 2103
- 3347 Ocean Harbor Dr
- 3292 Murdock Ave
- 254 Thompson Ave
- 66 Virginia Ave
- 450 Morea St
- 308 Moore Ave
- 25 Alhambra Dr
- 3250 Messick Ave
- 81 Alhambra Dr
- 29 W Henrietta Ave
- 3391 Lawrence Ave
- 3530 Long Beach Rd Unit 8
- 3560 Hampton Rd
- 561 Bothner St
- 480 Brown Ct
- 566 Bothner St
- 567 Bothner St
- 3527 Westminster Rd
- 3521 Westminster Rd
- 573 Bothner St
- 3517 Westminster Rd
- 3511 Westminster Rd
- 3467 Hampton Rd
- 579 Bothner St
- 3507 Westminster Rd
- 3526 Westminster Rd
- 3480 Hampton Rd
- 573 Yale St
- 3501 Westminster Rd
- 584 Bothner St
- 585 Bothner St
- 3495 Westminster Rd
Your Personal Tour Guide
Ask me questions while you tour the home.