Estimated Value: $572,000 - $644,000
--
Bed
4
Baths
1,670
Sq Ft
$362/Sq Ft
Est. Value
About This Home
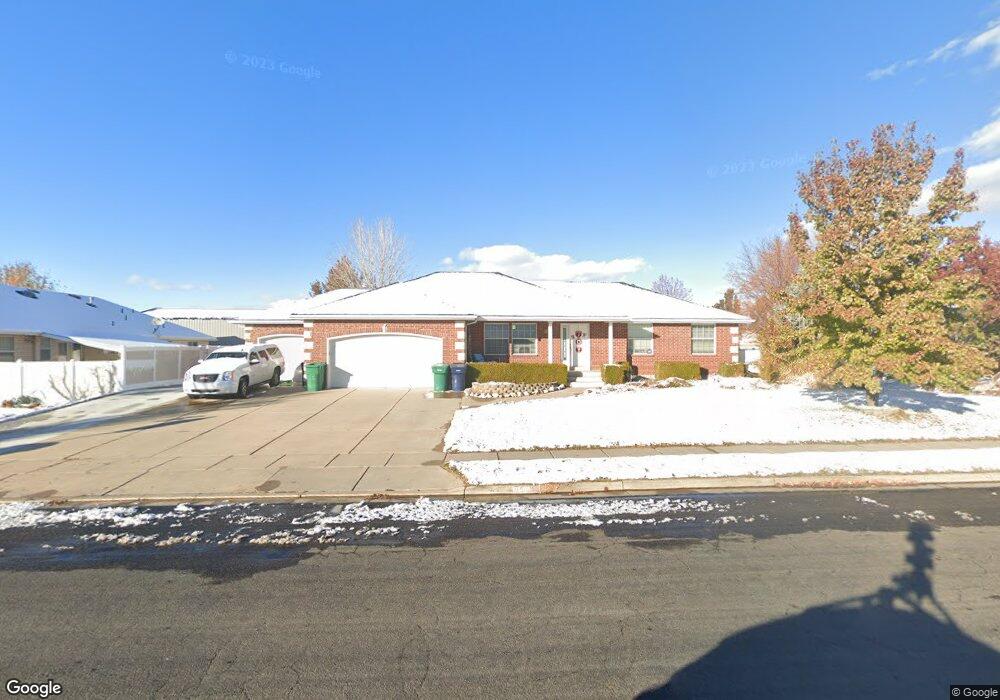
This home is located at 3578 W 5700 S, Roy, UT 84067 and is currently estimated at $605,270, approximately $362 per square foot. 3578 W 5700 S is a home located in Weber County with nearby schools including Midland School, Roy Junior High School, and Roy High School.
Ownership History
Date
Name
Owned For
Owner Type
Purchase Details
Closed on
Aug 30, 2019
Sold by
Zimmerman Shawn and Zimmerman Monica
Bought by
Zimmerman Shawn M and Zimmerman Monica W
Current Estimated Value
Home Financials for this Owner
Home Financials are based on the most recent Mortgage that was taken out on this home.
Original Mortgage
$267,769
Outstanding Balance
$178,033
Interest Rate
3.7%
Mortgage Type
New Conventional
Estimated Equity
$427,237
Purchase Details
Closed on
May 31, 2006
Sold by
Owens Rex V and Owens Deborah A
Bought by
Zimmerman Shawn and Zimmerman Monica
Create a Home Valuation Report for This Property
The Home Valuation Report is an in-depth analysis detailing your home's value as well as a comparison with similar homes in the area
Home Values in the Area
Average Home Value in this Area
Purchase History
| Date | Buyer | Sale Price | Title Company |
|---|---|---|---|
| Zimmerman Shawn M | -- | First American Title Ins Co | |
| Zimmerman Shawn | -- | Heritage West |
Source: Public Records
Mortgage History
| Date | Status | Borrower | Loan Amount |
|---|---|---|---|
| Open | Zimmerman Shawn M | $267,769 |
Source: Public Records
Tax History Compared to Growth
Tax History
| Year | Tax Paid | Tax Assessment Tax Assessment Total Assessment is a certain percentage of the fair market value that is determined by local assessors to be the total taxable value of land and additions on the property. | Land | Improvement |
|---|---|---|---|---|
| 2025 | $3,888 | $634,184 | $175,636 | $458,548 |
| 2024 | $3,793 | $342,649 | $96,599 | $246,050 |
| 2023 | $3,609 | $326,150 | $96,497 | $229,653 |
| 2022 | $3,441 | $317,350 | $77,206 | $240,144 |
| 2021 | $2,975 | $453,000 | $85,258 | $367,742 |
| 2020 | $2,726 | $380,000 | $85,258 | $294,742 |
| 2019 | $2,675 | $352,000 | $64,993 | $287,007 |
| 2018 | $2,636 | $328,000 | $64,993 | $263,007 |
| 2017 | $2,617 | $307,000 | $55,014 | $251,986 |
| 2016 | $2,444 | $154,143 | $30,261 | $123,882 |
| 2015 | $2,362 | $153,421 | $35,712 | $117,709 |
| 2014 | $2,369 | $152,325 | $35,712 | $116,613 |
Source: Public Records
Map
Nearby Homes