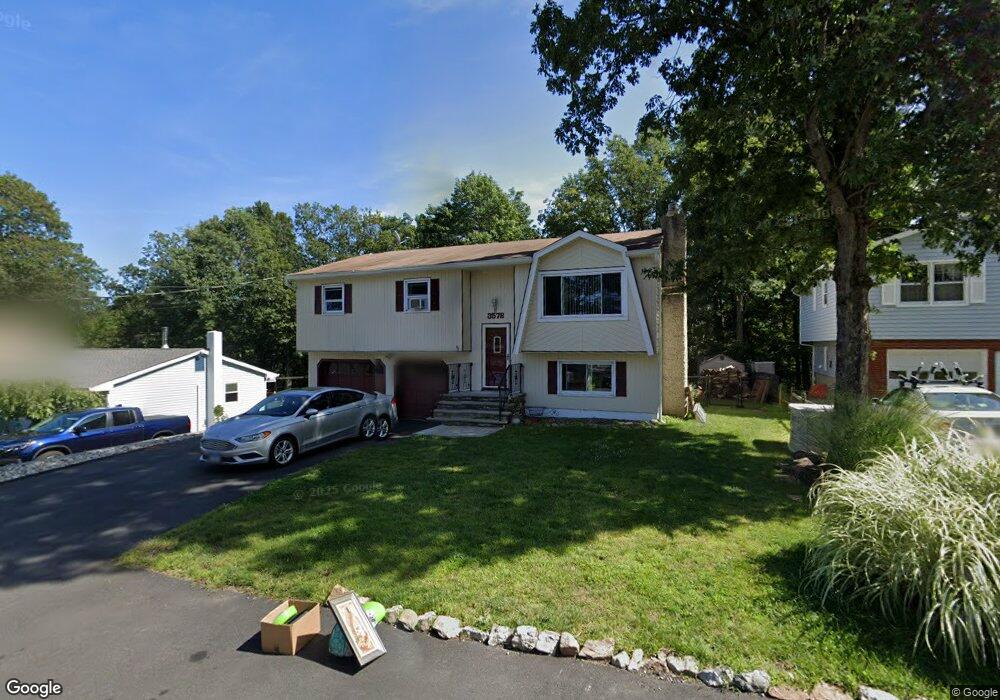
357B Dupont Ave Hopatcong, NJ 07843
Estimated Value: $439,000 - $565,000
--
Bed
--
Bath
1,564
Sq Ft
$308/Sq Ft
Est. Value
About This Home
This home is located at 357B Dupont Ave, Hopatcong, NJ 07843 and is currently estimated at $481,348, approximately $307 per square foot. 357B Dupont Ave is a home located in Sussex County with nearby schools including Hudson Maxim Elementary School, Durban Avenue Elementary School, and Tulsa Trail Elementary School.
Ownership History
Date
Name
Owned For
Owner Type
Purchase Details
Closed on
Sep 4, 2019
Sold by
Dickson Devin and Dickson Daisy
Bought by
Bennett Samantha and Bennett Chad
Current Estimated Value
Home Financials for this Owner
Home Financials are based on the most recent Mortgage that was taken out on this home.
Original Mortgage
$200,000
Outstanding Balance
$175,184
Interest Rate
3.6%
Mortgage Type
New Conventional
Estimated Equity
$306,164
Purchase Details
Closed on
Jan 31, 2005
Sold by
Dickinson Eric and Dickinson Marjorie
Bought by
Dickson Kevin and Dickson Daisy
Create a Home Valuation Report for This Property
The Home Valuation Report is an in-depth analysis detailing your home's value as well as a comparison with similar homes in the area
Home Values in the Area
Average Home Value in this Area
Purchase History
| Date | Buyer | Sale Price | Title Company |
|---|---|---|---|
| Bennett Samantha | $250,000 | Old Republic Natl Ttl Ins Co | |
| Dickson Kevin | $266,500 | Chicago Title Insurance Co |
Source: Public Records
Mortgage History
| Date | Status | Borrower | Loan Amount |
|---|---|---|---|
| Open | Bennett Samantha | $200,000 |
Source: Public Records
Tax History Compared to Growth
Tax History
| Year | Tax Paid | Tax Assessment Tax Assessment Total Assessment is a certain percentage of the fair market value that is determined by local assessors to be the total taxable value of land and additions on the property. | Land | Improvement |
|---|---|---|---|---|
| 2025 | $7,625 | $365,700 | $125,600 | $240,100 |
| 2024 | $7,120 | $365,700 | $125,600 | $240,100 |
| 2023 | $7,120 | $203,500 | $72,100 | $131,400 |
| 2022 | $6,980 | $203,500 | $72,100 | $131,400 |
| 2021 | $6,862 | $203,500 | $72,100 | $131,400 |
| 2020 | $6,791 | $203,500 | $72,100 | $131,400 |
| 2019 | $6,762 | $203,500 | $72,100 | $131,400 |
| 2018 | $6,748 | $203,500 | $72,100 | $131,400 |
| 2017 | $6,738 | $203,500 | $72,100 | $131,400 |
| 2016 | $6,752 | $203,500 | $72,100 | $131,400 |
| 2015 | $6,600 | $203,500 | $72,100 | $131,400 |
| 2014 | $6,577 | $203,500 | $72,100 | $131,400 |
Source: Public Records
Map
Nearby Homes
- 4 Kansas Way
- 23 Fordham Trail
- 66 Sutton Trail
- 14 Marshall Trail
- 34 Oklahoma Trail
- 208 Maxim Dr
- 354 Maxim Dr
- 8 Oneida Ave
- 114 Rollins Trail
- 496 River Styx Rd
- 35 Mountain Trail
- 167 Marne Rd
- 207 Dupont Ave
- 9 Papoose Trail
- 121 Bucknell Trail
- 8 Walton Rd
- 12 Bass Rock Rd
- 10 N River Styx Rd
- 38 W River Styx Rd
- 4 Bear Pond Trail
- 357A Dupont Ave
- 357 Dupont Ave
- 359 Dupont Ave
- 355 Dupont Ave
- 361 Dupont Ave
- 358 Dupont Ave
- 356 Dupont Ave
- 353 Dupont Ave
- 354B Dupont Ave
- 363 Dupont Ave
- 351 Dupont Ave
- 354 Dupont Ave
- 354A Dupont Ave
- 354 A Dupont Ave
- 177 Rollins Trail
- 175 Rollins Trail
- 42 Sutton Trail
- 173 Rollins Trail
- 44A Sutton Trail
- 44 Sutton Trail