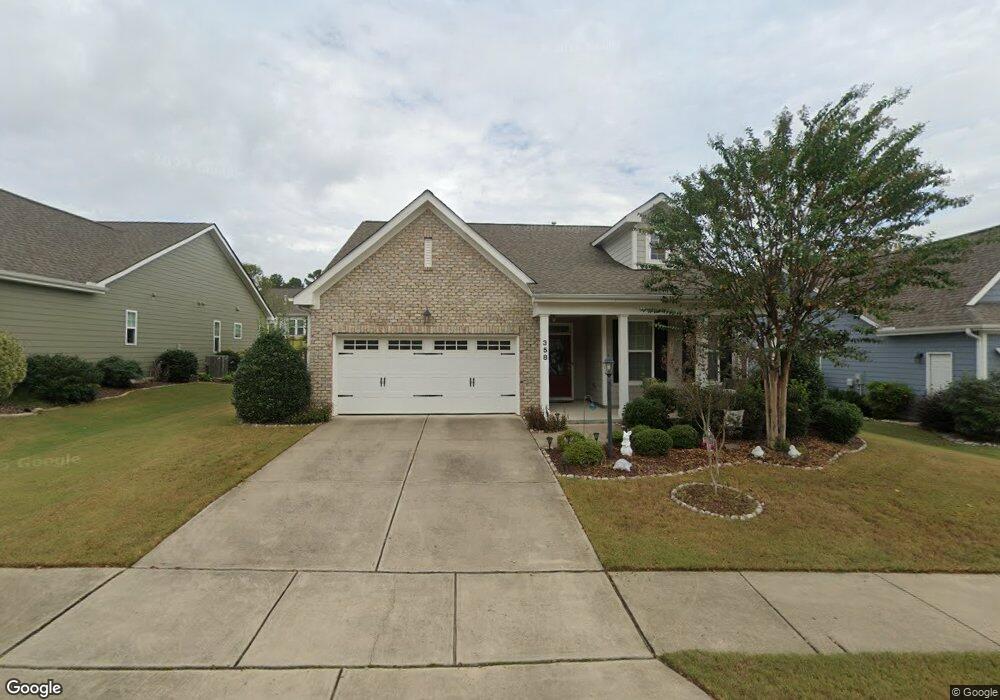
358 Apalachia Lake Dr Unit 1127 Fuquay Varina, NC 27526
Estimated Value: $435,488 - $489,000
3
Beds
2
Baths
1,723
Sq Ft
$271/Sq Ft
Est. Value
About This Home
This home is located at 358 Apalachia Lake Dr Unit 1127, Fuquay Varina, NC 27526 and is currently estimated at $466,372, approximately $270 per square foot. 358 Apalachia Lake Dr Unit 1127 is a home located in Wake County with nearby schools including Carolina Charter Academy.
Ownership History
Date
Name
Owned For
Owner Type
Purchase Details
Closed on
Aug 29, 2019
Sold by
Lowe Charles M
Bought by
Property Resolution Services Llc
Current Estimated Value
Home Financials for this Owner
Home Financials are based on the most recent Mortgage that was taken out on this home.
Original Mortgage
$370,000
Outstanding Balance
$323,381
Interest Rate
3.6%
Mortgage Type
Commercial
Estimated Equity
$142,991
Purchase Details
Closed on
Nov 4, 2016
Sold by
Terramor Homes Inc
Bought by
Goldstein Karen A and Goldstein Bob
Home Financials for this Owner
Home Financials are based on the most recent Mortgage that was taken out on this home.
Original Mortgage
$125,001
Interest Rate
3.48%
Mortgage Type
New Conventional
Purchase Details
Closed on
May 25, 2016
Sold by
South Lakes Investors Llc
Bought by
Terramor Homes Inc
Home Financials for this Owner
Home Financials are based on the most recent Mortgage that was taken out on this home.
Original Mortgage
$197,250
Interest Rate
3.58%
Mortgage Type
Construction
Create a Home Valuation Report for This Property
The Home Valuation Report is an in-depth analysis detailing your home's value as well as a comparison with similar homes in the area
Home Values in the Area
Average Home Value in this Area
Purchase History
| Date | Buyer | Sale Price | Title Company |
|---|---|---|---|
| Property Resolution Services Llc | $310,000 | None Listed On Document | |
| Property Resolution Services Llc | $310,000 | None Listed On Document | |
| Goldstein Karen A | $286,000 | None Available | |
| Terramor Homes Inc | $128,000 | None Available |
Source: Public Records
Mortgage History
| Date | Status | Borrower | Loan Amount |
|---|---|---|---|
| Open | Property Resolution Services Llc | $370,000 | |
| Closed | Property Resolution Services Llc | $370,000 | |
| Previous Owner | Goldstein Karen A | $125,001 | |
| Previous Owner | Terramor Homes Inc | $197,250 |
Source: Public Records
Tax History Compared to Growth
Tax History
| Year | Tax Paid | Tax Assessment Tax Assessment Total Assessment is a certain percentage of the fair market value that is determined by local assessors to be the total taxable value of land and additions on the property. | Land | Improvement |
|---|---|---|---|---|
| 2025 | $3,523 | $400,291 | $110,000 | $290,291 |
| 2024 | $3,509 | $400,291 | $110,000 | $290,291 |
| 2023 | $3,227 | $288,413 | $64,000 | $224,413 |
| 2022 | $3,032 | $288,413 | $64,000 | $224,413 |
| 2021 | $2,890 | $288,413 | $64,000 | $224,413 |
| 2020 | $2,890 | $288,413 | $64,000 | $224,413 |
| 2019 | $2,904 | $250,074 | $64,000 | $186,074 |
| 2018 | $2,738 | $260,300 | $64,000 | $196,300 |
| 2017 | $2,747 | $64,000 | $64,000 | $0 |
| 2016 | $661 | $64,000 | $64,000 | $0 |
Source: Public Records
Map
Nearby Homes
- 420 Apalachia Lake Dr
- 2942 Wilkes Lake Dr
- 331 Apalachia Lake Dr
- 639 Ashe Lake Way
- 719 Shoals Lake Dr
- 858 Lake Artesia Ln
- 2709 Banks Lake Ct
- 521 Lake Gaston Dr
- 515 Glenville Lake Dr
- 2405 Heathland Farm Dr
- 3301 Cobham Ct
- 3408 Apple Meadow Dr
- 3409 Bennyfield Ct
- 747 Catherine Lake Ct
- 3316 Jones Lake Rd
- 112 Wilbur Lake Dr
- 417 Long Lake Dr
- 3509 Bailey Lake Dr
- 101 Boone Lake Way
- 787 Magnolia Acres Ln
- 358 Apalachia Lake Dr
- 354 Apalachia Lake Dr
- 354 Apalachia Lake Dr Unit 1126
- 362 Apalachia Lake Dr Unit 1128
- 362 Apalachia Lake Dr Unit DRIVE
- 2844 Wilkes Lake Dr Unit 1135
- 2836 Wilkes Lake Dr Unit 1133
- 370 Apalachia Lake Dr
- 370 Apalachia Lake Dr Unit 1129
- 350 Apalachia Lake Dr
- 350 Apalachia Lake Dr Unit 1125
- 2840 Wilkes Lake Dr Unit 1134
- 355 Apalachia Lake Dr
- 355 Apalachia Lake Dr Unit 1115
- 359 Apalachia Lake Dr Unit 1114
- 2848 Wilkes Lake Dr Unit 1136
- 2832 Wilkes Lake Dr Unit 1132
- 2832 Wilkes Lake Dr
- 347 Apalachia Lake Dr Unit 1116
- 347 Apalachia Lake Dr Unit DRIVE