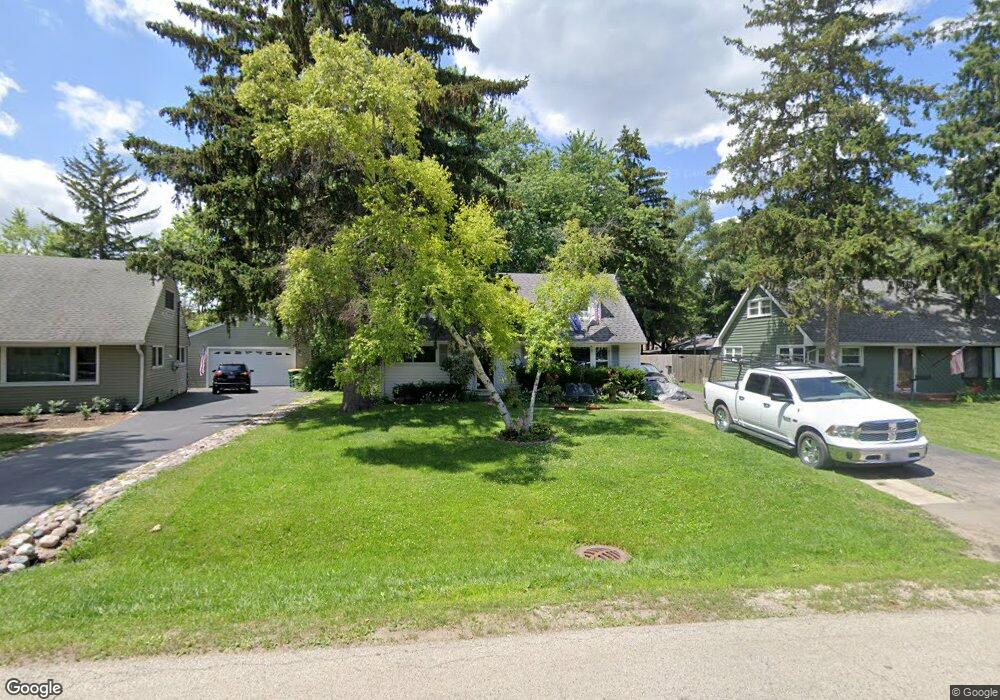
358 Behm Dr Grayslake, IL 60030
Estimated Value: $198,000 - $329,000
4
Beds
2
Baths
1,499
Sq Ft
$194/Sq Ft
Est. Value
About This Home
This home is located at 358 Behm Dr, Grayslake, IL 60030 and is currently estimated at $290,391, approximately $193 per square foot. 358 Behm Dr is a home located in Lake County with nearby schools including Woodview School, Frederick School, and Grayslake Middle School.
Ownership History
Date
Name
Owned For
Owner Type
Purchase Details
Closed on
Jun 19, 2018
Sold by
Singh Tejinder and Singh Seema
Bought by
Singh Family Trust
Current Estimated Value
Purchase Details
Closed on
May 10, 2005
Sold by
Best Joseph G
Bought by
Singh Tejinder and Singh Seema
Home Financials for this Owner
Home Financials are based on the most recent Mortgage that was taken out on this home.
Original Mortgage
$156,000
Outstanding Balance
$82,434
Interest Rate
6.05%
Mortgage Type
Fannie Mae Freddie Mac
Estimated Equity
$207,957
Purchase Details
Closed on
Mar 10, 1999
Sold by
Parks Bret A and Parks Tamara
Bought by
Best Joseph G
Home Financials for this Owner
Home Financials are based on the most recent Mortgage that was taken out on this home.
Original Mortgage
$118,400
Interest Rate
6.89%
Purchase Details
Closed on
Jan 29, 1999
Sold by
Galuski Thomas W and Parks Bret
Bought by
Parks Bret A
Home Financials for this Owner
Home Financials are based on the most recent Mortgage that was taken out on this home.
Original Mortgage
$118,400
Interest Rate
6.89%
Create a Home Valuation Report for This Property
The Home Valuation Report is an in-depth analysis detailing your home's value as well as a comparison with similar homes in the area
Home Values in the Area
Average Home Value in this Area
Purchase History
| Date | Buyer | Sale Price | Title Company |
|---|---|---|---|
| Singh Family Trust | -- | Attorney | |
| Singh Tejinder | $196,500 | Attorneys Title Guaranty Fun | |
| Best Joseph G | $148,000 | -- | |
| Parks Bret A | -- | -- |
Source: Public Records
Mortgage History
| Date | Status | Borrower | Loan Amount |
|---|---|---|---|
| Open | Singh Tejinder | $156,000 | |
| Previous Owner | Best Joseph G | $118,400 |
Source: Public Records
Tax History
| Year | Tax Paid | Tax Assessment Tax Assessment Total Assessment is a certain percentage of the fair market value that is determined by local assessors to be the total taxable value of land and additions on the property. | Land | Improvement |
|---|---|---|---|---|
| 2024 | $8,391 | $81,608 | $19,176 | $62,432 |
| 2023 | $7,866 | $71,331 | $16,761 | $54,570 |
| 2022 | $7,866 | $65,575 | $8,183 | $57,392 |
| 2021 | $7,796 | $63,028 | $7,865 | $55,163 |
| 2020 | $7,822 | $59,969 | $7,483 | $52,486 |
| 2019 | $7,568 | $57,535 | $7,179 | $50,356 |
| 2018 | $8,332 | $63,383 | $19,972 | $43,411 |
| 2017 | $8,502 | $61,204 | $18,788 | $42,416 |
| 2016 | $8,214 | $56,497 | $17,343 | $39,154 |
| 2015 | $8,068 | $51,614 | $15,844 | $35,770 |
| 2014 | $7,721 | $49,376 | $13,529 | $35,847 |
| 2012 | $7,533 | $51,567 | $14,129 | $37,438 |
Source: Public Records
Map
Nearby Homes
- 346 Mitchell Dr
- 492 Patricia Ct
- 367 N Lake St
- 75 Whispering Oaks Ln
- 220 Bluff Ct
- 226 Bluff Ct
- 232 Bluff Ct
- 26155 W Il Route 120
- 21570 W Eldor Ave
- 21238 W Washington St
- 417 Lawrence Ave
- 34110 S Circle Dr
- 146 Westerfield Place
- 338 S Lake St
- 349 S Lake St
- 1074 Potomac Ct
- 202 Centennial Dr
- 470 Ziegler Dr
- 34049 N Hickory Ave
- 32100 Alleghany Rd
Your Personal Tour Guide
Ask me questions while you tour the home.