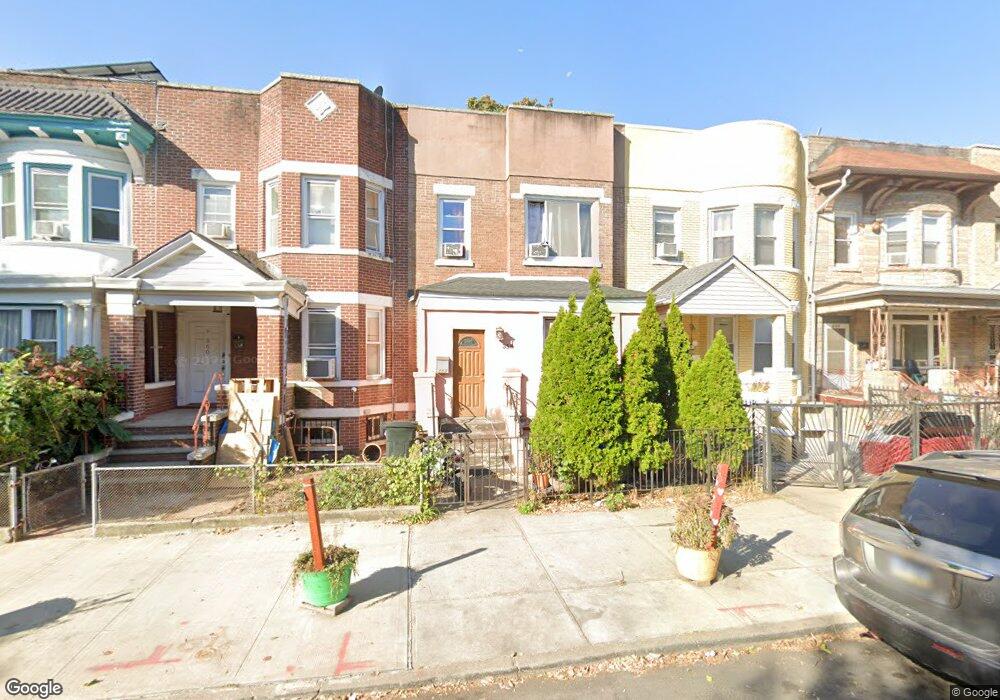
358 E 26th St Brooklyn, NY 11226
Flatbush NeighborhoodEstimated Value: $765,000 - $1,181,000
3
Beds
2
Baths
1,552
Sq Ft
$586/Sq Ft
Est. Value
About This Home
This home is located at 358 E 26th St, Brooklyn, NY 11226 and is currently estimated at $909,555, approximately $586 per square foot. 358 E 26th St is a home located in Kings County with nearby schools including Middle School 246 Walt Whitman, Central Brooklyn Ascend Charter, and Midwood Montessori.
Ownership History
Date
Name
Owned For
Owner Type
Purchase Details
Closed on
Mar 16, 2020
Sold by
Begum Johanara and Hossain Mohammad
Bought by
Hossain Fam Tr
Current Estimated Value
Purchase Details
Closed on
Aug 15, 2017
Sold by
Lafayette Capital Corp
Bought by
Begum Johanara and Hossain Mohammad
Home Financials for this Owner
Home Financials are based on the most recent Mortgage that was taken out on this home.
Original Mortgage
$424,000
Interest Rate
3.96%
Mortgage Type
New Conventional
Purchase Details
Closed on
Sep 11, 2012
Sold by
Duzer Realty Corp
Bought by
Lafayette Capital Corp
Purchase Details
Closed on
Jul 21, 2008
Sold by
Silberzweig David
Bought by
Duzer Realty Corp
Purchase Details
Closed on
Sep 7, 2007
Sold by
Lipscomb Alvin and Lipscomb Calvin
Bought by
Lipscomb Josephine
Create a Home Valuation Report for This Property
The Home Valuation Report is an in-depth analysis detailing your home's value as well as a comparison with similar homes in the area
Home Values in the Area
Average Home Value in this Area
Purchase History
| Date | Buyer | Sale Price | Title Company |
|---|---|---|---|
| Hossain Fam Tr | -- | -- | |
| Hossain Fam Tr | -- | -- | |
| Begum Johanara | $530,000 | -- | |
| Begum Johanara | $530,000 | -- | |
| Lafayette Capital Corp | -- | -- | |
| Lafayette Capital Corp | -- | -- | |
| Duzer Realty Corp | -- | -- | |
| Silberzweig David | -- | -- | |
| Duzer Realty Corp | -- | -- | |
| Silberzweig David | -- | -- | |
| Lipscomb Josephine | -- | -- | |
| Duzer Realty Corp | $250,000 | -- | |
| Lipscomb Josephine | -- | -- |
Source: Public Records
Mortgage History
| Date | Status | Borrower | Loan Amount |
|---|---|---|---|
| Previous Owner | Begum Johanara | $424,000 | |
| Closed | Silberzweig David | $0 |
Source: Public Records
Tax History
| Year | Tax Paid | Tax Assessment Tax Assessment Total Assessment is a certain percentage of the fair market value that is determined by local assessors to be the total taxable value of land and additions on the property. | Land | Improvement |
|---|---|---|---|---|
| 2025 | $4,806 | $53,100 | $14,460 | $38,640 |
| 2024 | $4,806 | $54,420 | $14,460 | $39,960 |
| 2023 | $4,584 | $54,900 | $14,460 | $40,440 |
| 2022 | $4,252 | $50,400 | $14,460 | $35,940 |
| 2021 | $4,461 | $49,800 | $14,460 | $35,340 |
| 2020 | $2,211 | $46,560 | $14,460 | $32,100 |
| 2019 | $4,171 | $37,020 | $14,460 | $22,560 |
| 2018 | $3,835 | $18,811 | $5,639 | $13,172 |
| 2017 | $3,618 | $17,749 | $5,836 | $11,913 |
| 2016 | $3,531 | $17,665 | $7,840 | $9,825 |
| 2015 | $1,800 | $17,612 | $7,564 | $10,048 |
| 2014 | $1,800 | $16,616 | $8,564 | $8,052 |
Source: Public Records
Map
Nearby Homes
- 324 E 26th St
- 316 E 26th St
- 333 E 26th St
- 357 E 26th St
- 2471 Bedford Ave
- 250 E 25th St
- 2465 Bedford Ave
- 247 E 26th St
- 1173 Rogers Ave Unit 5-BB
- 1173 Rogers Ave Unit 5C
- 332 E 28th St
- 2724 Clarendon Rd Unit 1
- 2236 Vanderveer Place
- 315 E 28th St
- 1193 Rogers Ave
- 259 E 28th St Unit 3
- 2701 Newkirk Ave Unit 3D
- 2701 Newkirk Ave Unit 3A
- 2701 Newkirk Ave Unit 7A
- 2701 Newkirk Ave Unit 3H
- 354 E 26th St
- 360 E 26th St
- 352 E 26th St
- 362 E 26th St
- 350 E 26th St
- 350 E 26 Th St Unit NA
- 366 E 26 Th St Unit 2
- 366 E 26 Th St
- 366 E 26th St Unit 2
- 366 E 26th St
- 348 E 26th St
- 368 E 26th St
- 346 E 26th St
- 357 E 25th St
- 353 E 25th St
- 361 E 25th St
- 351 E 25th St
- 372 E 26th St
- 359 E 25th St
- 359 E 25 Th St Unit 2
Your Personal Tour Guide
Ask me questions while you tour the home.