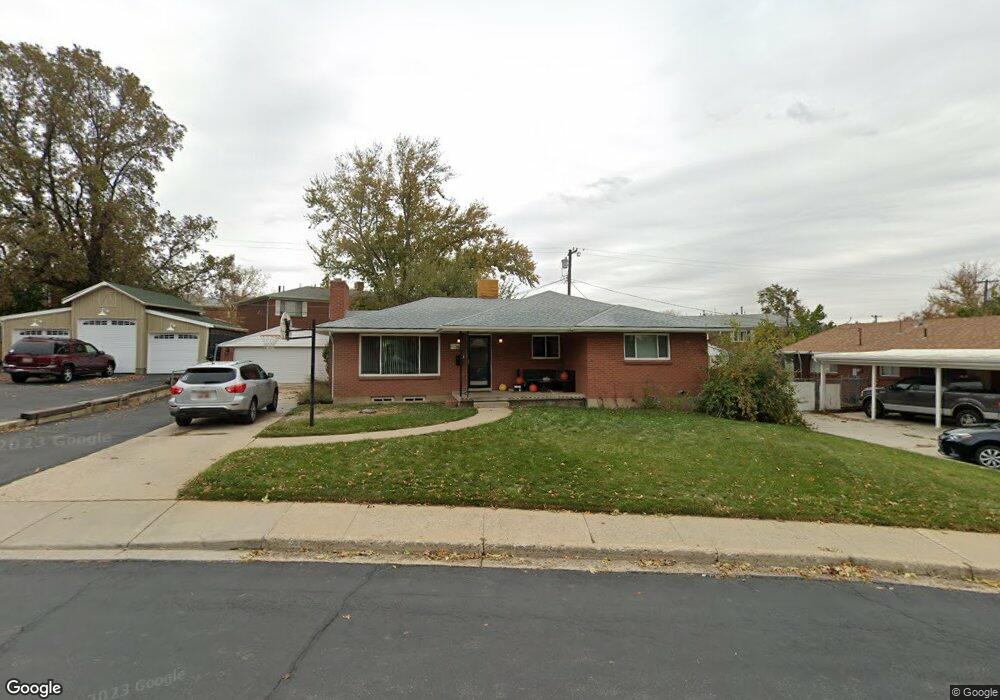
358 E 550 N Bountiful, UT 84010
Estimated Value: $502,000 - $543,000
4
Beds
2
Baths
1,252
Sq Ft
$420/Sq Ft
Est. Value
About This Home
This home is located at 358 E 550 N, Bountiful, UT 84010 and is currently estimated at $525,493, approximately $419 per square foot. 358 E 550 N is a home located in Davis County with nearby schools including Tolman School, Bountiful Junior High School, and Viewmont High School.
Ownership History
Date
Name
Owned For
Owner Type
Purchase Details
Closed on
Aug 17, 2021
Sold by
Carr Adam E and Carr Tami K
Bought by
Carr Adam Edwin and Carr Tami Kay
Current Estimated Value
Home Financials for this Owner
Home Financials are based on the most recent Mortgage that was taken out on this home.
Original Mortgage
$263,000
Outstanding Balance
$239,148
Interest Rate
2.9%
Mortgage Type
New Conventional
Estimated Equity
$286,345
Purchase Details
Closed on
Nov 28, 2001
Sold by
Wiser Ryan S and Wiser Sarah A
Bought by
Carr Adam E and Carr Tami K
Home Financials for this Owner
Home Financials are based on the most recent Mortgage that was taken out on this home.
Original Mortgage
$148,667
Interest Rate
6.63%
Mortgage Type
FHA
Purchase Details
Closed on
Jul 8, 1998
Sold by
Ellsworth F Don and Ellsworth Luciel M
Bought by
Wiser Ryan S and Wiser Sarah A
Purchase Details
Closed on
Oct 15, 1996
Sold by
Ellsworth F Don and Ellsworth Luciel M
Bought by
Ellsworth F Don and Ellsworth Luciel M
Create a Home Valuation Report for This Property
The Home Valuation Report is an in-depth analysis detailing your home's value as well as a comparison with similar homes in the area
Purchase History
| Date | Buyer | Sale Price | Title Company |
|---|---|---|---|
| Carr Adam Edwin | -- | Hickman Land Title | |
| Carr Adam E | -- | Backman Stewart Title Servic | |
| Wiser Ryan S | -- | Avis & Archibald Title Ins | |
| Ellsworth F Don | -- | -- |
Source: Public Records
Mortgage History
| Date | Status | Borrower | Loan Amount |
|---|---|---|---|
| Open | Carr Adam Edwin | $263,000 | |
| Closed | Carr Adam E | $148,667 |
Source: Public Records
Tax History
| Year | Tax Paid | Tax Assessment Tax Assessment Total Assessment is a certain percentage of the fair market value that is determined by local assessors to be the total taxable value of land and additions on the property. | Land | Improvement |
|---|---|---|---|---|
| 2025 | $2,956 | $270,600 | $123,558 | $147,042 |
| 2024 | $2,785 | $264,550 | $107,919 | $156,631 |
| 2023 | $2,753 | $475,000 | $200,887 | $274,113 |
| 2022 | $2,713 | $256,300 | $110,330 | $145,970 |
| 2021 | $2,309 | $332,000 | $144,291 | $187,709 |
| 2020 | $2,046 | $295,000 | $124,015 | $170,985 |
| 2019 | $2,125 | $300,000 | $136,245 | $163,755 |
| 2018 | $1,993 | $277,000 | $133,676 | $143,324 |
| 2016 | $1,551 | $115,720 | $53,886 | $61,834 |
| 2015 | $1,543 | $108,845 | $53,886 | $54,959 |
| 2014 | $1,531 | $111,216 | $53,886 | $57,330 |
| 2013 | -- | $106,502 | $41,880 | $64,622 |
Source: Public Records
Map
Nearby Homes
- 513 N 400 E Unit 14B
- 453 N 400 E Unit 7-D
- 17 E 400 N Unit 19B
- 978 N 170 E
- 683 E 100 N
- 49 E 200 N Unit 4
- 41 E 200 N Unit 6
- 55 E 200 N Unit 2
- 51 E 200 N Unit 3
- 256 N Main St
- 254 N Main St
- 252 N Main St
- 129 N 800 E
- 214 E 1250 N
- 6 N 800 E
- 106 W 700 N
- 698 E 200 S
- 255 E 400 S
- 320 N 200 W Unit 4
- 357 S 100 E
Your Personal Tour Guide
Ask me questions while you tour the home.