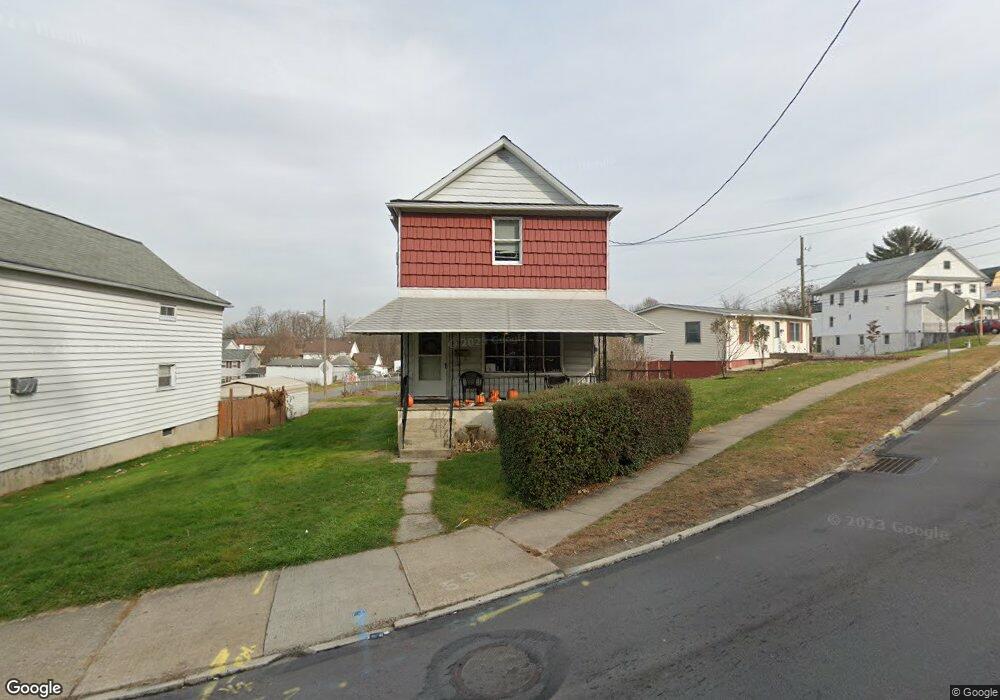
358 E Main St Wilkes Barre, PA 18705
Estimated Value: $191,000 - $229,000
3
Beds
2
Baths
1,440
Sq Ft
$142/Sq Ft
Est. Value
About This Home
This home is located at 358 E Main St, Wilkes Barre, PA 18705 and is currently estimated at $204,198, approximately $141 per square foot. 358 E Main St is a home located in Luzerne County with nearby schools including Leo E. Solomon-Plains Elementary School, Solomon/Plains Junior High School, and Al Noor Islamic Academy.
Ownership History
Date
Name
Owned For
Owner Type
Purchase Details
Closed on
Jun 11, 2019
Sold by
Menendez Vincent M
Bought by
358 E Main St Llc
Current Estimated Value
Home Financials for this Owner
Home Financials are based on the most recent Mortgage that was taken out on this home.
Original Mortgage
$62,050
Outstanding Balance
$54,335
Interest Rate
3.9%
Mortgage Type
Commercial
Estimated Equity
$149,863
Purchase Details
Closed on
Jan 27, 1986
Bought by
Menendez Vincent M
Create a Home Valuation Report for This Property
The Home Valuation Report is an in-depth analysis detailing your home's value as well as a comparison with similar homes in the area
Home Values in the Area
Average Home Value in this Area
Purchase History
| Date | Buyer | Sale Price | Title Company |
|---|---|---|---|
| 358 E Main St Llc | $73,000 | None Available | |
| Menendez Vincent M | -- | -- |
Source: Public Records
Mortgage History
| Date | Status | Borrower | Loan Amount |
|---|---|---|---|
| Open | 358 E Main St Llc | $62,050 |
Source: Public Records
Tax History Compared to Growth
Tax History
| Year | Tax Paid | Tax Assessment Tax Assessment Total Assessment is a certain percentage of the fair market value that is determined by local assessors to be the total taxable value of land and additions on the property. | Land | Improvement |
|---|---|---|---|---|
| 2025 | $9,685 | $58,300 | $18,500 | $39,800 |
| 2024 | $9,685 | $58,300 | $18,500 | $39,800 |
| 2023 | $9,685 | $58,300 | $18,500 | $39,800 |
| 2022 | $9,674 | $58,300 | $18,500 | $39,800 |
| 2021 | $9,674 | $58,300 | $18,500 | $39,800 |
| 2020 | $9,674 | $58,300 | $18,500 | $39,800 |
| 2019 | $9,639 | $58,300 | $18,500 | $39,800 |
| 2018 | $9,605 | $58,300 | $18,500 | $39,800 |
| 2017 | $9,570 | $58,300 | $18,500 | $39,800 |
| 2016 | -- | $58,300 | $18,500 | $39,800 |
| 2015 | -- | $58,300 | $18,500 | $39,800 |
| 2014 | -- | $58,300 | $18,500 | $39,800 |
Source: Public Records
Map
Nearby Homes