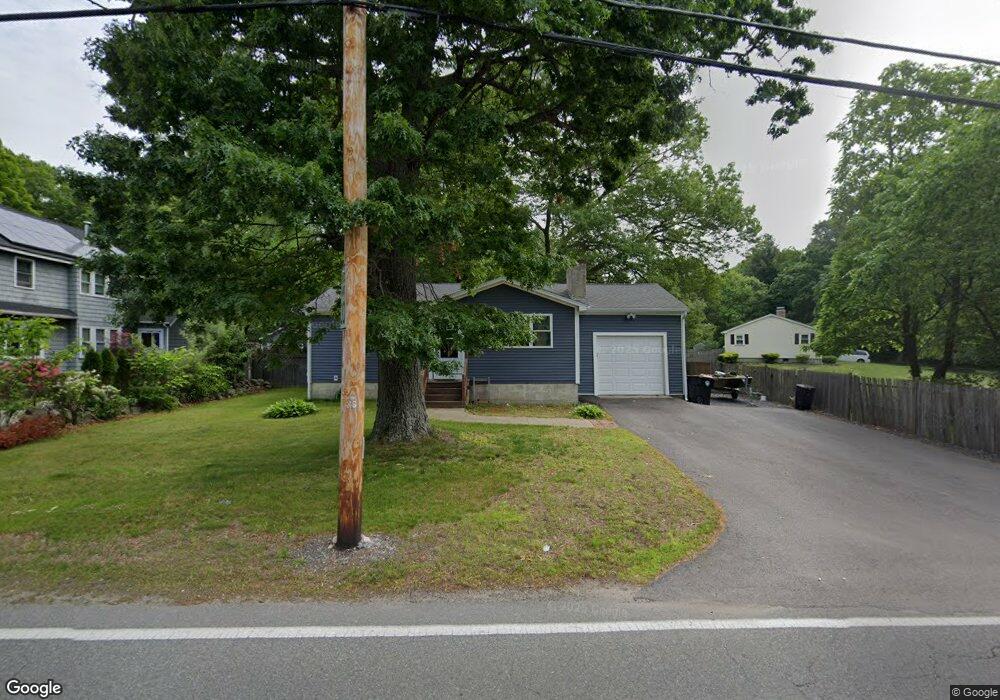
358 East St Brockton, MA 02302
Estimated Value: $413,000 - $426,000
2
Beds
1
Bath
804
Sq Ft
$524/Sq Ft
Est. Value
About This Home
This home is located at 358 East St, Brockton, MA 02302 and is currently estimated at $420,971, approximately $523 per square foot. 358 East St is a home located in Plymouth County with nearby schools including Davis K-8 School, John F. Kennedy Elementary School, and South Middle School.
Ownership History
Date
Name
Owned For
Owner Type
Purchase Details
Closed on
Aug 27, 2020
Sold by
Blanchette Steven P and Blanchette Cheryl A
Bought by
Blanchette David
Current Estimated Value
Home Financials for this Owner
Home Financials are based on the most recent Mortgage that was taken out on this home.
Original Mortgage
$130,150
Outstanding Balance
$115,500
Interest Rate
2.9%
Mortgage Type
New Conventional
Estimated Equity
$305,471
Create a Home Valuation Report for This Property
The Home Valuation Report is an in-depth analysis detailing your home's value as well as a comparison with similar homes in the area
Home Values in the Area
Average Home Value in this Area
Purchase History
| Date | Buyer | Sale Price | Title Company |
|---|---|---|---|
| Blanchette David | $137,000 | None Available |
Source: Public Records
Mortgage History
| Date | Status | Borrower | Loan Amount |
|---|---|---|---|
| Open | Blanchette David | $130,150 |
Source: Public Records
Tax History Compared to Growth
Tax History
| Year | Tax Paid | Tax Assessment Tax Assessment Total Assessment is a certain percentage of the fair market value that is determined by local assessors to be the total taxable value of land and additions on the property. | Land | Improvement |
|---|---|---|---|---|
| 2025 | $4,500 | $371,600 | $156,900 | $214,700 |
| 2024 | $4,498 | $374,200 | $156,900 | $217,300 |
| 2023 | $4,241 | $326,700 | $107,000 | $219,700 |
| 2022 | $3,786 | $271,000 | $97,200 | $173,800 |
| 2021 | $3,515 | $242,400 | $89,200 | $153,200 |
| 2020 | $3,324 | $219,400 | $78,700 | $140,700 |
| 2019 | $2,996 | $192,800 | $74,700 | $118,100 |
| 2018 | $2,835 | $176,500 | $74,700 | $101,800 |
| 2017 | $2,631 | $163,400 | $74,700 | $88,700 |
| 2016 | $2,434 | $140,200 | $71,300 | $68,900 |
| 2015 | $2,223 | $122,500 | $71,300 | $51,200 |
| 2014 | $2,281 | $125,800 | $71,300 | $54,500 |
Source: Public Records
Map
Nearby Homes