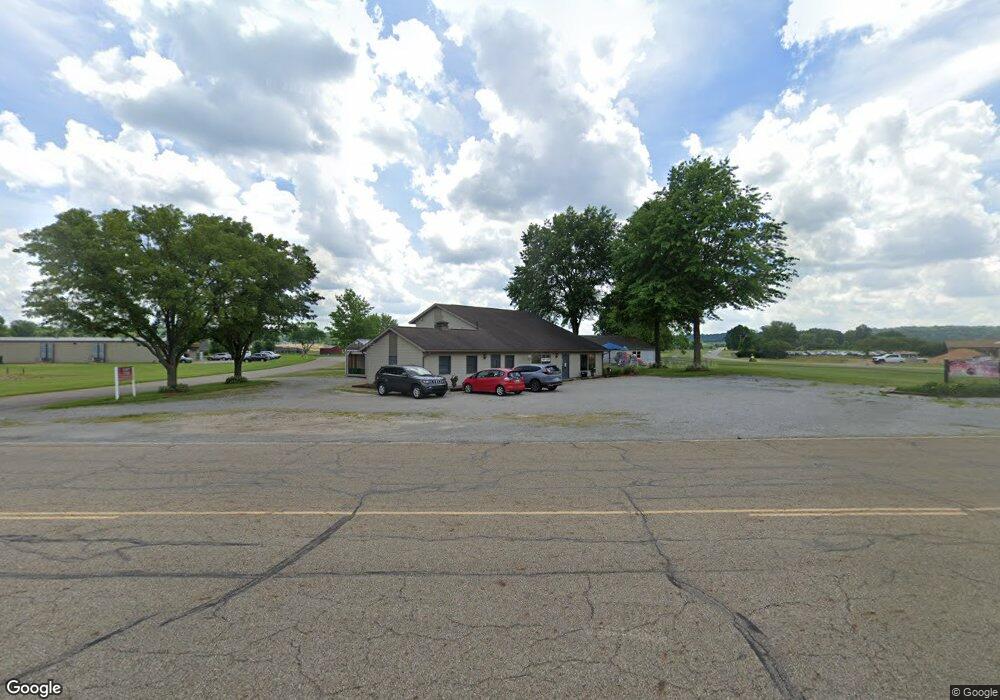
358 Edgebrook Rd NE Bolivar, OH 44612
Estimated Value: $574,227
--
Bed
--
Bath
2,200
Sq Ft
$261/Sq Ft
Est. Value
About This Home
This home is located at 358 Edgebrook Rd NE, Bolivar, OH 44612 and is currently estimated at $574,227, approximately $261 per square foot. 358 Edgebrook Rd NE is a home located in Tuscarawas County with nearby schools including Tuscarawas Valley Primary School, Tuscarawas Valley Intermediate School, and Tuscarawas Valley Middle School.
Ownership History
Date
Name
Owned For
Owner Type
Purchase Details
Closed on
Dec 5, 2018
Sold by
Davis Danielle C and Davis Fmtr
Bought by
Davis Gabrielle N and Davis Fmtr Terri L
Current Estimated Value
Purchase Details
Closed on
Aug 11, 2016
Sold by
Davis James D and Davis Terri L
Bought by
Davis Danielle C
Purchase Details
Closed on
Sep 10, 2014
Sold by
Watson Natalie M and Saunders Heather D
Bought by
Davis James and Davis Terri L
Purchase Details
Closed on
Dec 4, 2013
Sold by
Petrarca Anthony J and Watson Natalie M
Bought by
Watson Natalie M and Saunders Heather D
Purchase Details
Closed on
Jun 23, 2008
Sold by
Estate Of Patricia L Petrarca
Bought by
Petrarca Anthony J
Purchase Details
Closed on
Jan 2, 2003
Sold by
Price Patricia L
Bought by
Davis James D and Davis Terri L
Purchase Details
Closed on
May 16, 1991
Sold by
Ensley Austin M
Bought by
Davis James and Patricia Dba Dov
Create a Home Valuation Report for This Property
The Home Valuation Report is an in-depth analysis detailing your home's value as well as a comparison with similar homes in the area
Home Values in the Area
Average Home Value in this Area
Purchase History
| Date | Buyer | Sale Price | Title Company |
|---|---|---|---|
| Davis Gabrielle N | -- | None Available | |
| Davis Danielle C | -- | None Available | |
| Davis James | $250,000 | None Available | |
| Watson Natalie M | -- | None Available | |
| Petrarca Anthony J | -- | None Available | |
| Petrarca Anthony J | -- | None Available | |
| Davis James D | $250,000 | -- | |
| Davis James | $30,000 | -- |
Source: Public Records
Mortgage History
| Date | Status | Borrower | Loan Amount |
|---|---|---|---|
| Closed | Davis James D | $0 |
Source: Public Records
Tax History Compared to Growth
Tax History
| Year | Tax Paid | Tax Assessment Tax Assessment Total Assessment is a certain percentage of the fair market value that is determined by local assessors to be the total taxable value of land and additions on the property. | Land | Improvement |
|---|---|---|---|---|
| 2024 | $4,493 | $79,300 | $15,480 | $63,820 |
| 2023 | $4,493 | $226,570 | $44,230 | $182,340 |
| 2022 | $4,496 | $79,300 | $15,481 | $63,819 |
| 2021 | $4,092 | $68,881 | $17,028 | $51,853 |
| 2020 | $4,097 | $68,881 | $17,028 | $51,853 |
| 2019 | $3,898 | $68,881 | $17,028 | $51,853 |
| 2018 | $3,981 | $68,880 | $17,030 | $51,850 |
| 2017 | $4,053 | $68,880 | $17,030 | $51,850 |
| 2016 | $4,002 | $68,880 | $17,030 | $51,850 |
| 2014 | $3,938 | $63,550 | $15,480 | $48,070 |
| 2013 | $3,332 | $63,550 | $15,480 | $48,070 |
Source: Public Records
Map
Nearby Homes
- 10884 Madlyn St NE
- 720 Holly St NE
- 10952 Madlyn St NE
- 10988 Madlyn St NE
- 827 Melissa St NE
- 379 Olde Orchard Dr NE
- 0 Kerns Dr NE
- 11275 Indian Hills Dr NE
- 0 State Route 212 Unit 4441887
- 10419 Laurens Dr NE
- 9738 Kennett Square NE
- VL Hess Mill Rd NE
- 224 Yant St
- 11162 Northwood Ave NE
- 11167 Northwood Ave NE
- 1517 NE North Orchard Rd
- 1557 N Orchard Rd NE
- 12239 Sherman Church Rd NE
- 10784 Fisher Rd NW
- 1001 Mill Circle Dr NE
- 364 Edgebrook Rd NE
- 298 Edgebrook Rd NE
- 361 Edgebrook Rd NE
- 10748 Wilkshire Blvd NE
- 10922 State Route 212 NE
- 10884 State Route 212 NE
- 10804 Wilkshire Blvd NE
- 10880 State Route 212 NE
- 0 Wilkshire Blvd Unit 3690658
- 10848 State Route 212 NE
- 10911 State Route 212 NE Unit 1
- 10911 State Route 212 NE Unit 2
- 10911 Ohio 212
- 10802 State Route 212 NE
- 0 Fairoaks Rd NE
- 10874 Madlyn St NE
- 10898 Madlyn St NE
- 738 Holly St NE
- 10916 Madlyn St NE
- 733 Holly St NE