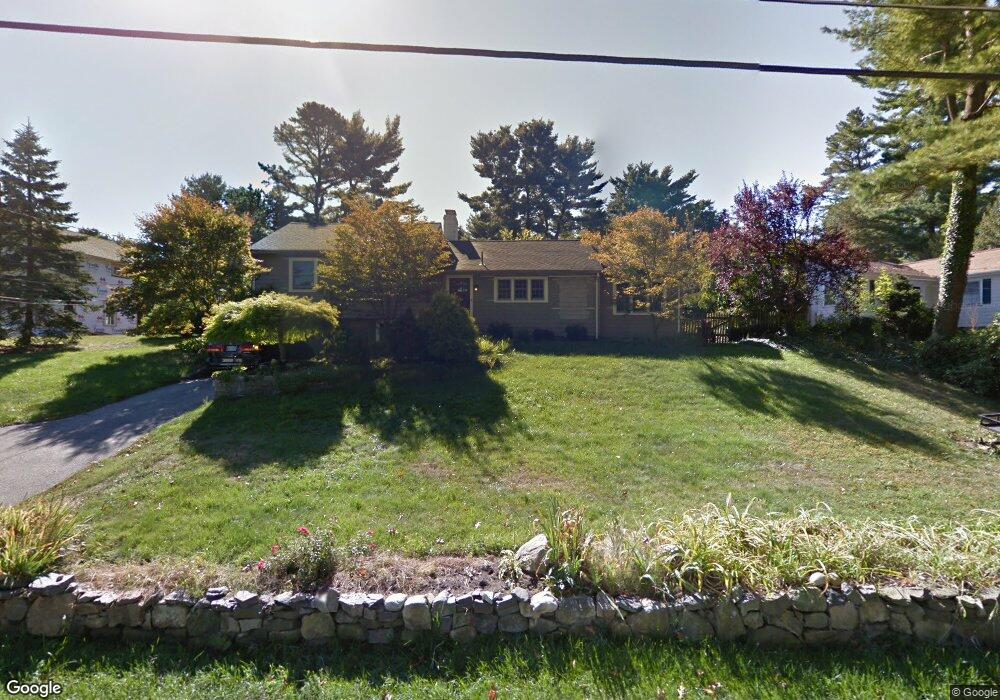
358 Franklin St Reading, MA 01867
Estimated Value: $795,029 - $947,000
2
Beds
2
Baths
1,550
Sq Ft
$543/Sq Ft
Est. Value
About This Home
This home is located at 358 Franklin St, Reading, MA 01867 and is currently estimated at $841,507, approximately $542 per square foot. 358 Franklin St is a home located in Middlesex County with nearby schools including Wood End Elementary School, Arthur W. Coolidge Middle School, and Reading Memorial High School.
Ownership History
Date
Name
Owned For
Owner Type
Purchase Details
Closed on
Jun 23, 2025
Sold by
Deluca Scott and Deluca Julie
Bought by
Deluca Scott
Current Estimated Value
Purchase Details
Closed on
Oct 24, 2003
Sold by
Thomas Joann
Bought by
Deluca Julie and Deluca Scott
Home Financials for this Owner
Home Financials are based on the most recent Mortgage that was taken out on this home.
Original Mortgage
$340,000
Interest Rate
6.15%
Mortgage Type
Purchase Money Mortgage
Purchase Details
Closed on
Jan 8, 1998
Sold by
Cavazzoni J Paul
Bought by
Thomas Joann
Purchase Details
Closed on
Apr 28, 1994
Sold by
Moynihan Thomas F and Moynihan Anita L
Bought by
Cavazzoni J Paul
Purchase Details
Closed on
Dec 26, 1989
Sold by
Welford Donald L
Bought by
Moynihan Thomas F
Create a Home Valuation Report for This Property
The Home Valuation Report is an in-depth analysis detailing your home's value as well as a comparison with similar homes in the area
Home Values in the Area
Average Home Value in this Area
Purchase History
| Date | Buyer | Sale Price | Title Company |
|---|---|---|---|
| Deluca Scott | -- | None Available | |
| Deluca Scott | -- | None Available | |
| Deluca Julie | $425,000 | -- | |
| Deluca Julie | $425,000 | -- | |
| Thomas Joann | $246,500 | -- | |
| Thomas Joann | $246,500 | -- | |
| Cavazzoni J Paul | $216,000 | -- | |
| Cavazzoni J Paul | $216,000 | -- | |
| Moynihan Thomas F | $225,000 | -- | |
| Moynihan Thomas F | $225,000 | -- |
Source: Public Records
Mortgage History
| Date | Status | Borrower | Loan Amount |
|---|---|---|---|
| Previous Owner | Moynihan Thomas F | $400,000 | |
| Previous Owner | Deluca Julie | $340,000 |
Source: Public Records
Tax History
| Year | Tax Paid | Tax Assessment Tax Assessment Total Assessment is a certain percentage of the fair market value that is determined by local assessors to be the total taxable value of land and additions on the property. | Land | Improvement |
|---|---|---|---|---|
| 2025 | $8,782 | $771,000 | $482,400 | $288,600 |
| 2024 | $8,763 | $747,700 | $467,800 | $279,900 |
| 2023 | $8,200 | $651,300 | $407,500 | $243,800 |
| 2022 | $7,786 | $584,100 | $365,400 | $218,700 |
| 2021 | $4,452 | $552,600 | $350,800 | $201,800 |
| 2020 | $9,650 | $541,600 | $343,800 | $197,800 |
| 2019 | $7,340 | $515,800 | $327,400 | $188,400 |
| 2018 | $6,683 | $481,800 | $305,800 | $176,000 |
| 2017 | $6,462 | $460,600 | $292,400 | $168,200 |
| 2016 | $6,241 | $430,400 | $278,300 | $152,100 |
| 2015 | $5,846 | $397,700 | $257,200 | $140,500 |
| 2014 | $5,665 | $384,300 | $248,500 | $135,800 |
Source: Public Records
Map
Nearby Homes
- 119 Van Norden Rd
- 68 Sanborn Ln
- 50 Forest St
- 16 Briarwood Ave
- 150 Grove St
- 99 Grove St
- 32 Granger Ave
- 11 Clover Cir Unit A
- 44 Grandview Rd
- 27 Audubon Rd
- 28 Nutter Rd
- 42 Main St Unit 22
- 36 Main St Unit 1
- 0 Charles St Unit 72374573
- 141 Belmont St
- 17 Wakefield St
- 18 Symonds Way
- 584 Woburn St
- 2 Inwood Dr Unit 1005
- 41 Marcus Rd
- 364 Franklin St
- 350 Franklin St
- 60 Blueberry Ln
- 368 Franklin St
- 346 Franklin St
- 361 Franklin St
- 52 Blueberry Ln
- 355 Franklin St
- 378 Franklin St
- 365 Franklin St
- 349 Franklin St
- 75 Blueberry Ln
- 371 Franklin St
- 63 Blueberry Ln
- 384 Franklin St
- 44 Blueberry Ln
- 12 Sunset Rock Ln
- 377 Franklin St
- 341 Franklin St
- 55 Blueberry Ln
Your Personal Tour Guide
Ask me questions while you tour the home.